Creating a Dashboard
This page provides instructions for creating a new Hi-Res Analytic dashboard for a graphmart.
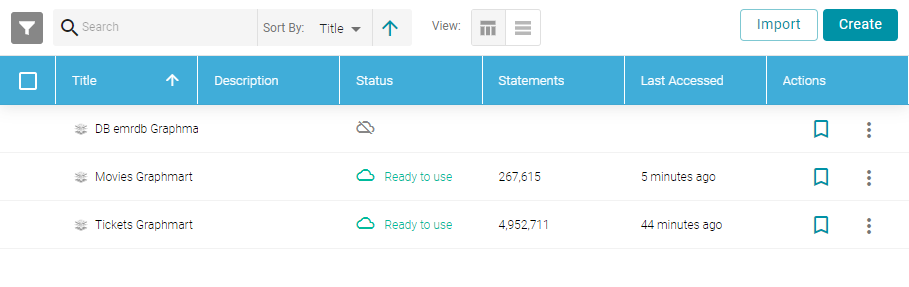
- In the Anzo application, expand the Blend menu and click Graphmarts. Anzo displays a list of the existing graphmarts. For example:
- On the Graphmarts screen, click the name of the graphmart for which you want to create a dashboard. Anzo displays the details for the graphmart. For example:
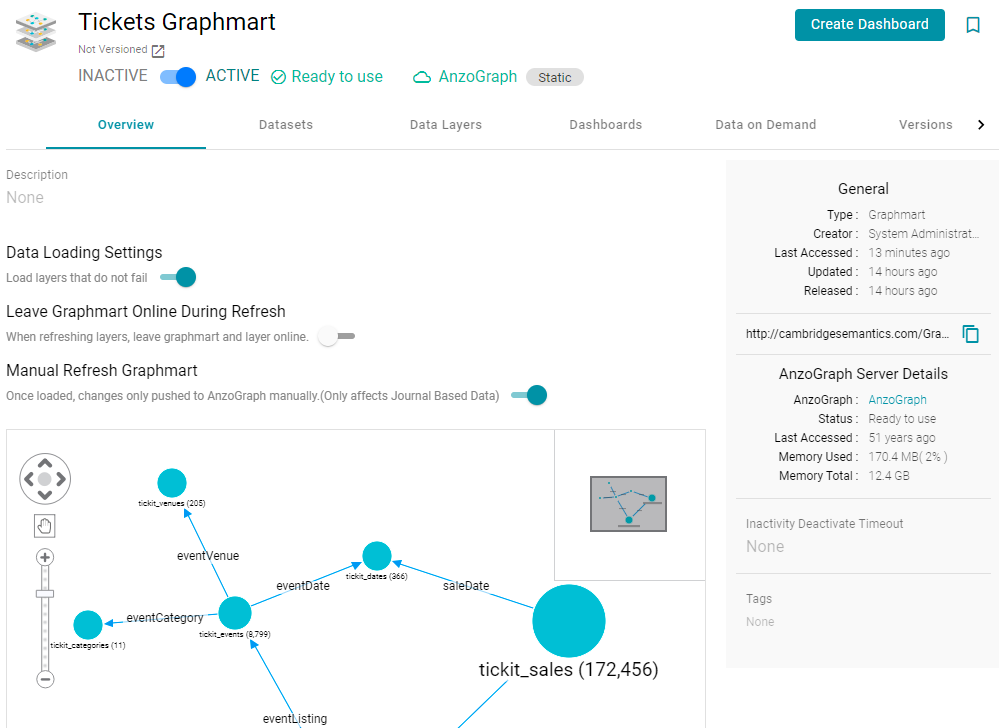
- On the Graphmart overview screen, click the Create Dashboard button. The Hi-Res Analytics application opens and displays the New Dashboard dialog box.
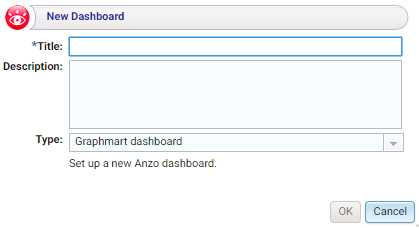
- Type a Title for the dashboard and enter an optional Description.
- Leave the default Graphmart dashboard value in the Type field and then click OK.
The new dashboard appears as a new tab on the screen and contains a sub-tab titled What can I do next?. This tab acts as a wizard to guide you through the initial dashboard creation.
- On the What can I do next? tab, click Specify the type of data you would like to see. The Select Data Types dialog box appears.
- In the Select Data Types dialog box, select the data type or class of data that you want to display on the dashboard. Anzo uses the type, along with any filters, to populate the visualizations (lenses) that you add to the dashboard.
Note Though you must choose one base data type for a dashboard, you can leverage the relationships in the graph to access and integrate data from additional classes. See Combining Data from Multiple Classes for more information. - Click OK to close the Select Data Types dialog box. The data type that you chose appears in the Data Types panel on the left side of the dashboard.
- In the main toolbar, click the Dashboard button and select Save.
Now that the dashboard basics are defined, see Creating a Lens and Creating a Dashboard Filter for instructions on adding lenses and filters to the dashboard.