Generating Source Data Metrics
To help users assess the quality of the data coming from a data source, Anzo provides the ability to calculate metrics for each source. When metrics are generated, Anzo profiles the entire source data set and reports statistics for each table in the schema, such as the number of populated, null, or empty rows for each column in a table and the number of rows for each column grouped by value. It also reports column-level metrics such as the smallest and largest values in a column, the number of unique values, and the value that appears most often. For schemas with multiple tables, Anzo also generates a list of foreign key suggestions between tables that include the same column.
Follow the instructions below to generate and review data quality metrics for a data source.
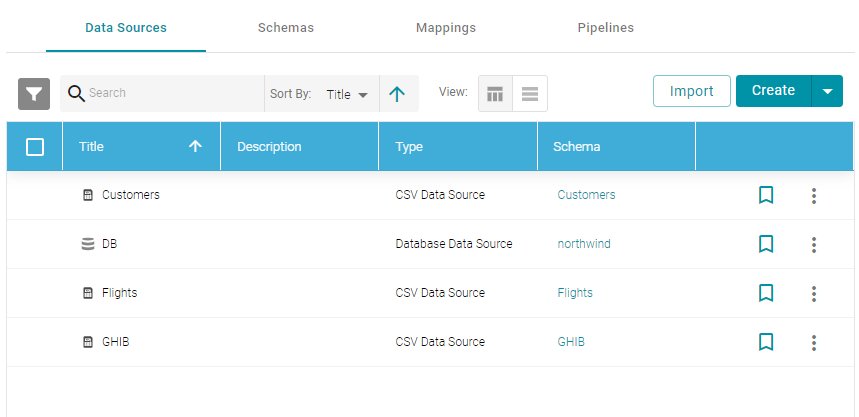
- In the Anzo console, expand the Onboard menu and click Structured Data. Anzo displays the Data Sources screen, which lists any existing data sources. For example:
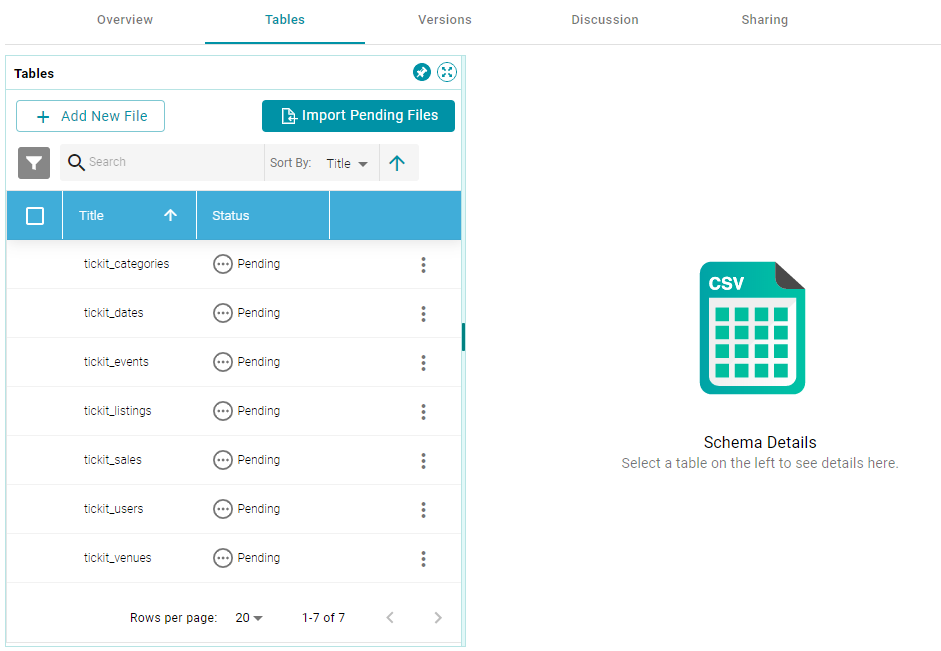
- Click the data source for which you want to generate metrics. Anzo displays the Tables tab for the source, which lists the schema and table details. For example:
- On the left side of the screen, select a row for a table in the schema. A view of the sample data and additional buttons are displayed on the right side of the screen. For example:
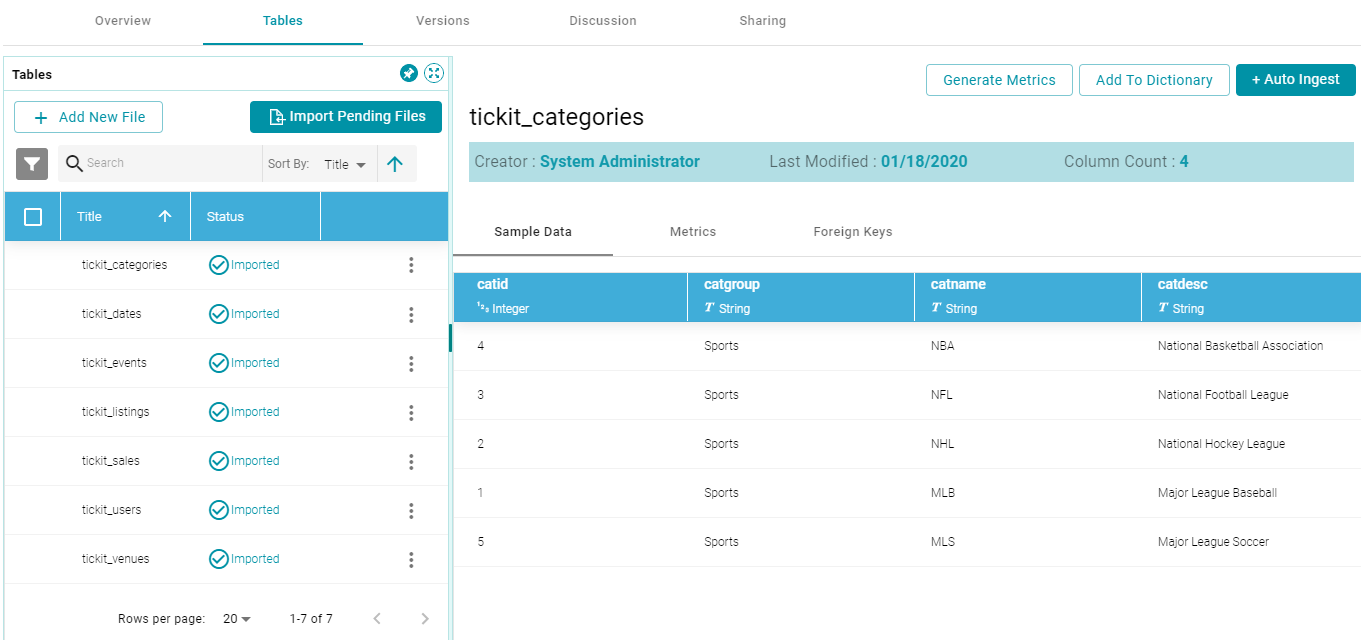
- Click the Generate Metrics button at the top of the screen. Anzo displays a warning that the process may consume a lot of server resources. Click Yes to continue. Anzo calculates metrics for the schema. The process may take several minutes. You can check the status of the process in the Activity Log.
- When the process is complete, click the Metrics tab next to the Sample Data tab in the middle of the screen. Anzo displays the metrics for the selected table. For example:
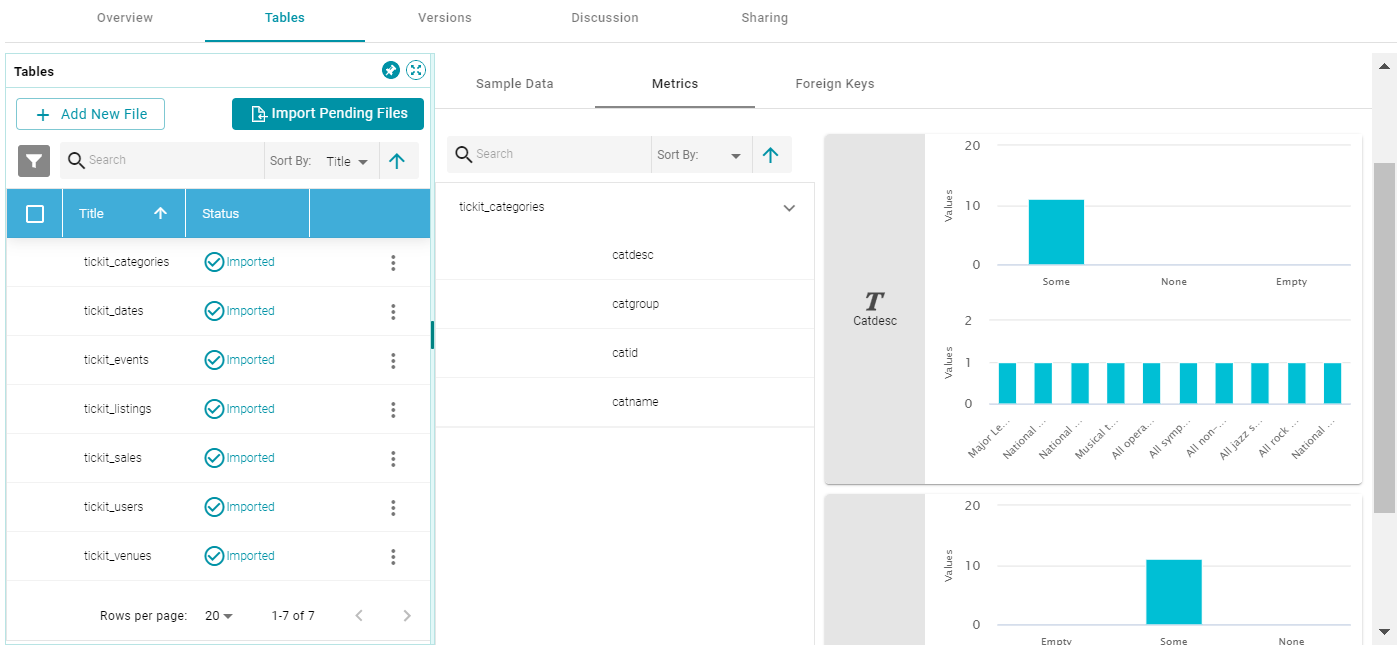
On the far right of the screen, Anzo shows the metrics for each column in the selected table. To select a different table, click another row on the left side of the screen. To view additional metrics for a column in the table, click a column name in the middle of the screen. For example:
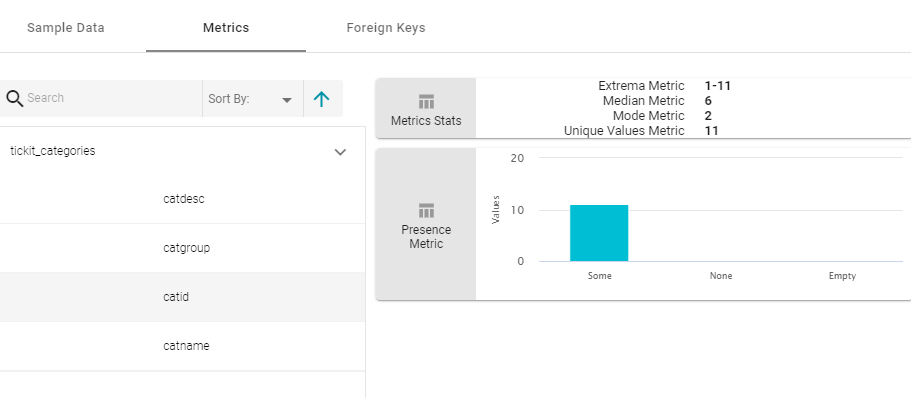
Depending on the data type of the column, one or more of the following metrics are shown:
- Extrema Metric: Shows the smallest and largest values.
- Median Metric: Shows the middle value.
- Mode Metric: Shows the value that appears most often.
- Unique Values Metric: Shows the number of unique values.
For additional metrics based on the type of data quality checks needed, contact Cambridge Semantics. For information about generating metrics for an onboarded data set, see Generating Graph Data Metrics.