Creating a Dashboard Filter
Filters narrow the data presented in a dashboard. You can define filter criteria using Microsoft Excel-like functions such as AVG, SUM, or UPPER, or groupings such as a date range or aggregation. When you add a filter to a dashboard, all lenses on the dashboard update simultaneously based on your filter selection. Though you can also filter data in some lens objects, such as a column, a filter applies across the entire dashboard. Unlike lenses, filters cannot be shared by other users or dashboards and must be created for each dashboard.
- Open the dashboard that you want to add a filter to.
- In the Hi-Res Analytics main toolbar, click Filters and select Create a filter. The Create Filter dialog box is displayed.
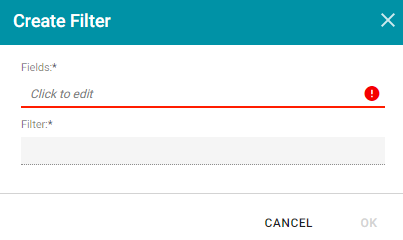
- Click in the Fields field to open the drop-down list and select a property or relative path to filter on. The list of available properties depends on the selected data type for the dashboard. The list below describes the icons and options that are available when choosing a property:
- The join symbol (
 ) denotes a property that is not linked to another class. A path icon (
 ) denotes a path; the property is linked to another class. Paths specify what data to display relative to the selected property. Selecting a property that is linked to another class navigates to the next class so that you can select one of the linked properties.
 - When you navigate to a new property, the breadcrumbs at the top of the dialog box show you the property path. You can click the eraser icon (
 ) to clear the path.
 - If you want to use a function or formula to determine the values that the filter returns, click the function button (
 ) and select a function from the drop-down list. The functions that become available in the list depend on the data type of the selected property. To choose a more advanced function or type a formula, click Advanced. The Calculated Value dialog box opens and enables you to choose additional properties and functions as well as type your own calculation. For more information, see Calculating Values in Lenses and Filters.
- The join symbol (
- When you have selected a Field for the filter, click the Close link to close the list and return to the Create Filter dialog box. Additional options are displayed on the screen.
- Click the Filter field to select the filter type. The list of available filters for lens depends on the selected property. For example, the Date Range filter only appears for date properties. For more information about each of the filter types, see Filter Type Reference.
- Cloud: Cloud filters display values in term clouds where each term is written in a font size that represents the number of results for that value. Unlike list filters, which enable you to select and filter on multiple values at once, cloud filters allow you to filter on one value at a time. The cloud filter is available for all data types but cannot be with used relative paths, which are indicated by a path icon () in the Create Filter dialog box.
- Date Range: Date Range filters enable you to define date ranges and group the results into those ranges. Date Range filters are available for properties with date and time data types.
- Hierarchy: Hierarchy filters data into hierarchical categories to display parent and child relationships.
Hierarchy filters are available only for relative paths (indicated by the path icon in the Create Filter dialog box) and not properties.
- Limit: Limit filters enable you to limit the results to the specified number of largest or smallest values. You can use limit filters for any data type. For strings, results are ordered alphabetically. Largest orders by the last letters in the alphabet and Smallest orders by the first letters in the alphabet.
- List: List filters display results in a list of distinct values and allow you to select and filter on multiple values at a time. The list filter is available for properties of all data types.
- Numeric Range: Numeric Range filters enable you to define numeric ranges and group the results into those ranges. Numeric Range filters are similar to Date Range filters but are available for properties with numeric (integer or double) data types. You can also perform a function on a property so that it results in a number value, such as using the COUNT function.
- Presence: Presence filters indicate the presence or absence of a selected property. Presence filters are useful for finding records that exclude a particular value. They are available for relative paths and properties of all data types.
- Quartile: Quartile filters group and rank the values for a property into four equal ranges. This filter requires a property with a numeric or date data type and is not available for relative paths.
- Range Slider: Range Slider filters display a slider control that enables you to filter results by a range that you specify by setting a minimum and maximum value. The Range Slider filter requires a property with numeric or date data type, or a function resulting in a number, such as COUNT
- Relative Time: Relative Time filters enable you to filter for records that fall into the specified time increment relative to the current time. Relative Time filters are available for properties with date data types.
- Search: Search filters are available for all data types and enable you to search for values in the selected property. For unstructured data, use the Full Text Search filter.
- Single Select List: Single Select List filters are similar to List filters but only allow you to select and filter on one value from the list at a time. This filter is available for properties of all data types but is not available for relative paths.
- Types: Types filters enable you to filter data according to the classes defined by a relative path.
This filter is available only for relative paths (indicated by the path icon in the Create Filter dialog box) and not properties.
- Cloud: Cloud filters display values in term clouds where each term is written in a font size that represents the number of results for that value. Unlike list filters, which enable you to select and filter on multiple values at once, cloud filters allow you to filter on one value at a time. The cloud filter is available for all data types but cannot be with used relative paths, which are indicated by a path icon (
- (Optional) In Filter Properties, add a Title. If you do not type a title, Anzo uses the property or path as the title.
- (Optional) Modify additional filter options as needed. Depending on the selected property and filter types that you selected, one or more of these options are available for configuration:
- Label Field: The property to show as the value for each list item in the filter if you want it to differ from the value that results from the property or relative path you chose in the Fields field.
- Exclude: Removes the selected property from the results.
- Show Bars: Displays the total values for the selected property as a bar graphic in the background of the filter.
- Show Blanks: Displays any null values for the selected property by including a “Blank” option in the filter.
- Show counts: Indicates whether the results of this filter change based on selections in other filters on the dashboard.
- Respond to other filters: Displays the number of results for the value.
- Interval Unit: Defines the unit of time for the Interval value.
- Interval: Defines the length of time in each grouping. For example, for a date field with an Interval Unit of "Decade," an Interval value of 2 creates groups of two-decade increments.
- Format Type: Enables you to change the format type for a date or number property.
- Create Filter: Enables you to specify a subfilter to further refine the results in the filter.
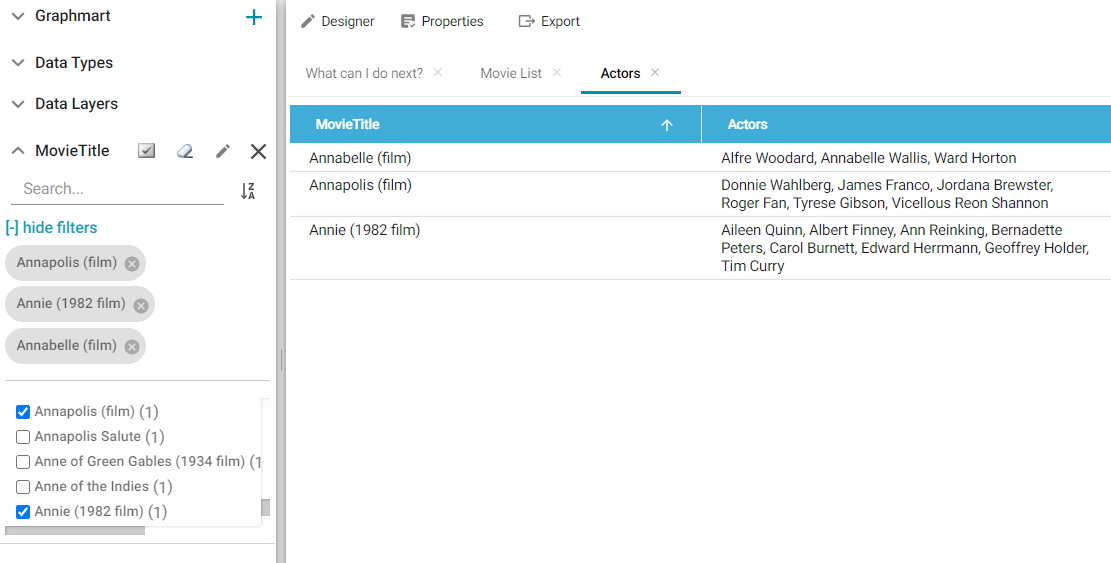
- When you finish configuring the filter, click OK. The new filter appears in the left-hand column of the dashboard and displays the values that are available for filtering the displayed data. For example, the image below shows a List filter for a dashboard that displays data about movie actors. The property for the filter is MovieTitle and selecting one or more titles in the filter narrows the scope of the dashboard to the actors who star in the selected movies.
- Save the dashboard to save the filter.