Monitoring AnzoGraph
This topic provides information about viewing AnzoGraph's memory usage, query performance statistics, and network bandwidth.
- Viewing Current Memory Usage
- Reviewing Query Performance Statistics
- Evaluating Network Performance on Clusters
Viewing Current Memory Usage
Follow the steps below to view AnzoGraph's current memory usage.
- In the Administration application, expand the Connections menu and select AnzoGraph. Anzo displays the AnzoGraph screen, which lists the connected AnzoGraph instances.
- Click the name of the instance that you want to evaluate. Anzo displays the Graphmarts screen for that instance. The memory usage details are displayed in the top right corner on all of the tabs. For example, the test instance below shows that 21% of the available memory is in use:
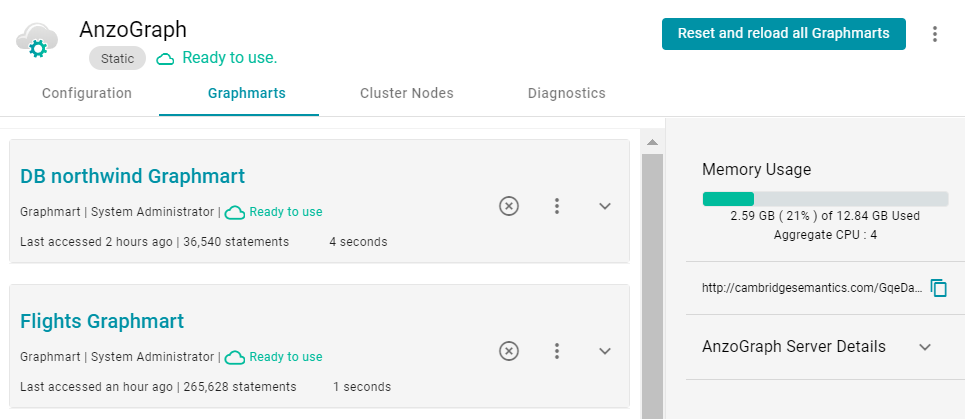
Ideally, the data at rest should use only 25%-30% of the available memory because query execution and intermediate result storage can temporarily consume a very large amount of RAM, especially when multiple users run queries concurrently. When memory usage increases so that the data uses more than 25% - 30% of the available memory, the status bar changes color to orange as a warning . For example:
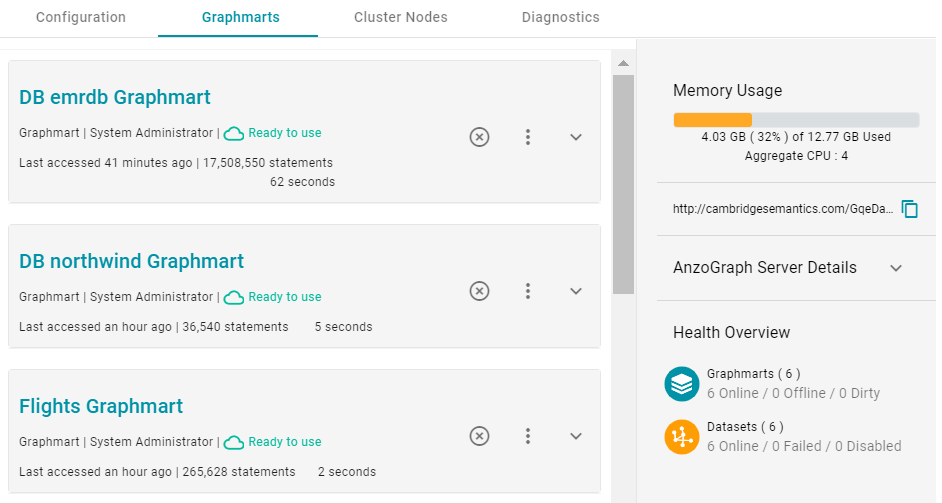
If memory usage for the data at rest remains above 50%, Cambridge Semantics recommends that you increase the amount of RAM available. For more information about memory usage, see Sizing Guidelines for In-Memory Storage.
Reviewing Query Performance Statistics
The System Query Audit log provides details about all system events. Users can filter the query audit log to view query execution times for AnzoGraph queries.
Viewing AnzoGraph Query Statistics
- In the Administration application, expand the Monitoring & Diagnostics menu and select System Query Audit. Anzo displays the Query Events log. For example:
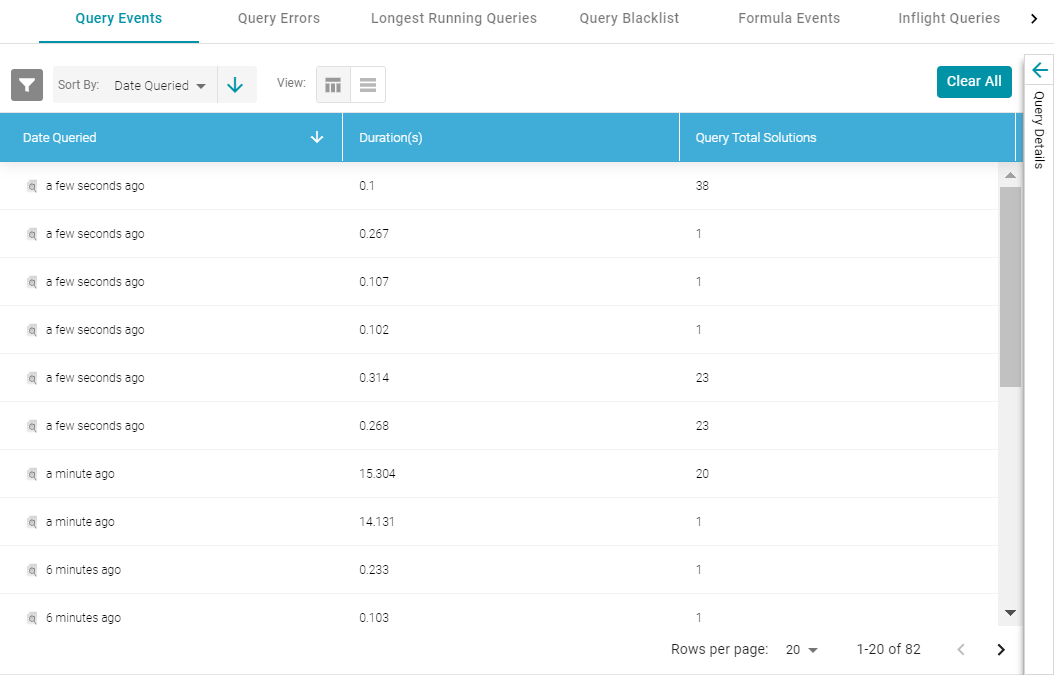
By default, the log shows an overview of all query events for all data sources. The table lists the date queried, the duration in milliseconds, and total number of solutions returned for each query event. You can select an event in the table to view details about that event, such as the target data source and query text, on the right side of the screen.
- To filter the events to display only AnzoGraph queries, open the Filters panel by clicking the filter icon (
 ) in the top left corner of the screen. For example:
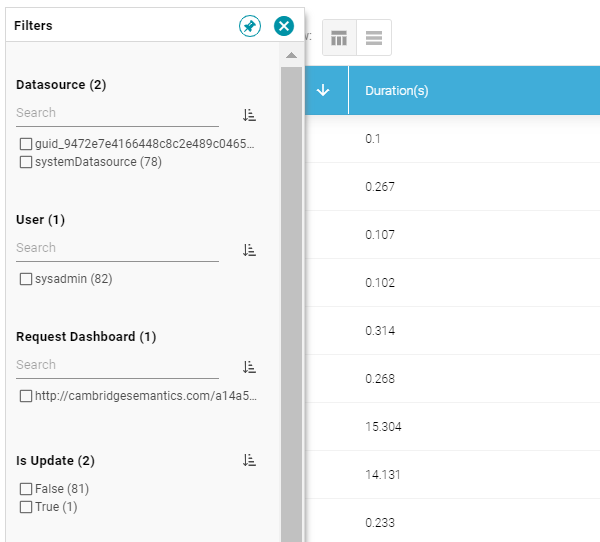
- In the Filters panel under Datasource, select the checkbox for the AnzoGraph data source. Typically the name starts with guid_. The table of events is filtered to display AnzoGraph events. At the top of the screen, you can choose between a table view (
 ) or list view (
 ), and you can sort by date, duration, or total solutions. For example, the image below shows a list view of AnzoGraph query events sorted by duration:
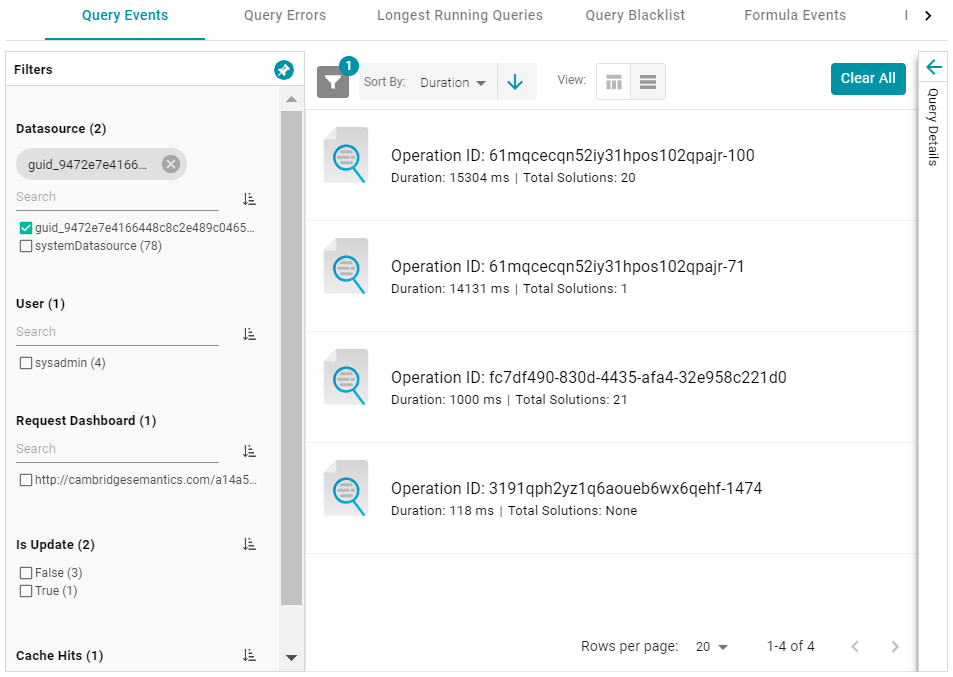
- Select any query in the list to view the event overview on the right side of the screen. For example:
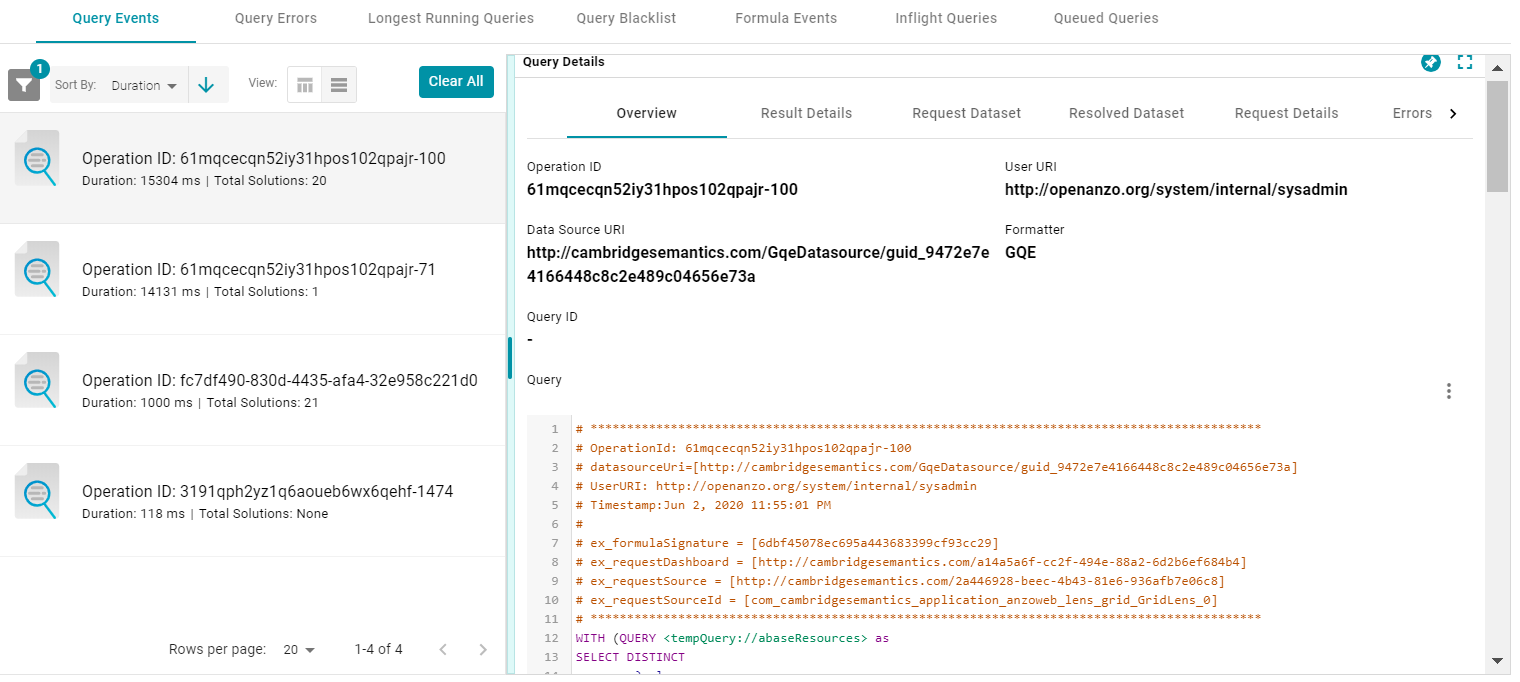
To view more details about the query event, click the additional tabs to the right of the Overview tab.
Evaluating Network Performance on Clusters
The AnzoGraph Diagnostics screen provides a network benchmark that you can run to evaluate the network bandwidth of a cluster.
Network performance is not applicable for single servers. The benchmark described below is not available for single-server AnzoGraph deployments.
Running the Network Benchmark
- In the Administration application, expand the Connections menu and select AnzoGraph. Anzo displays the AnzoGraph screen, which lists the connected AnzoGraph instances.
- Click the name of the cluster that you want to evaluate. Anzo displays the Graphmarts screen for the cluster.
- Click the Diagnostics tab and find the Network Benchmarking option at the bottom the screen. For example:
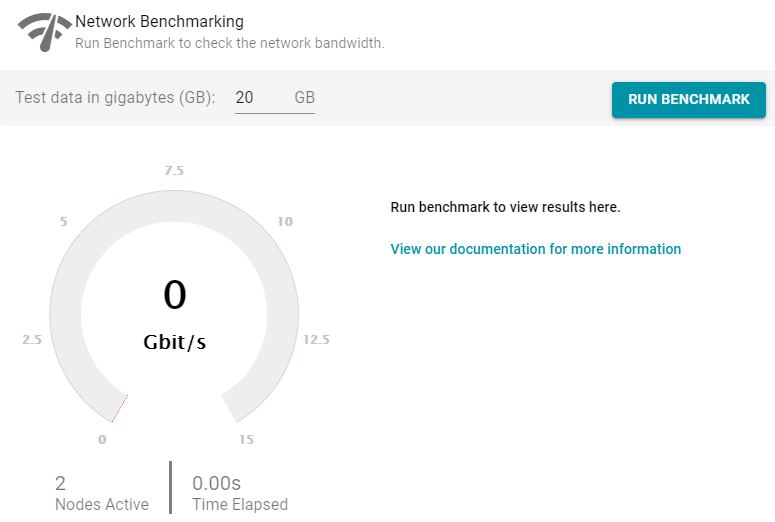
- By default, the benchmark is set to distribute 20 GB of data per node over the network. Each node in the cluster sends 20 GB to every other node. You can specify a different size if necessary. Note that increasing the value also increases the time to run the benchmark.
- To run the test, click the Run Benchmark button. Anzo runs the benchmark and displays the results. For example:
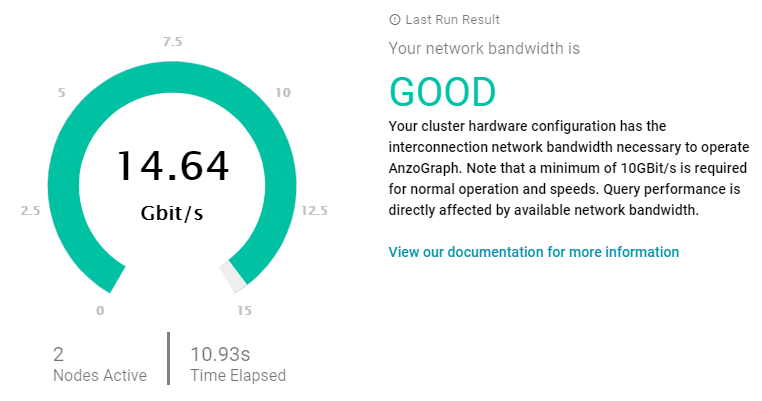
If the bandwidth is less than 10 Gbit/s, Anzo displays an "Insufficient" result. For example:
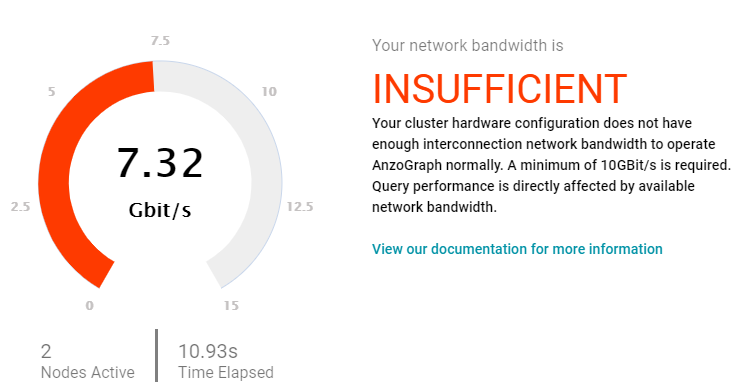
When the results are insufficient, Cambridge Semantics recommends that you increase the network bandwidth. You can continue to use the cluster with the expectation of slower performance for network-bound operations.