Creating a Limit Filter
Limit Filters are used to limit the results on the Dashboard to a specified number of either the largest or smallest values. The Limit Filter is available for any data type. For strings, results are ordered alphabetically. "Largest" orders by the last letters in the alphabet and "Smallest" orders by the first letters in the alphabet.
Follow the instructions below to create a Limit Filter.
- Open the Dashboard that you want to add the filter to.
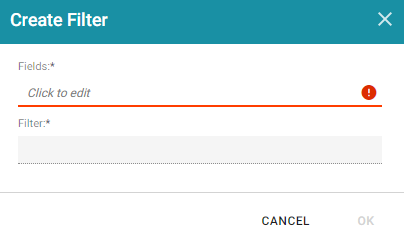
- In the Hi-Res Analytics main toolbar, click Filters and select Create a Filter. The Create Filter dialog box is displayed.
- Click in the Fields field to open the Property drop-down list and determine the property to filter on. The list of available properties depends on the selected Data Type for the Dashboard.
For example, the following image shows the list of properties that are available for a Dashboard whose source is a Graphmart that contains data about tickets sold for various types of events. The Data Type for the Dashboard is tickit_events:
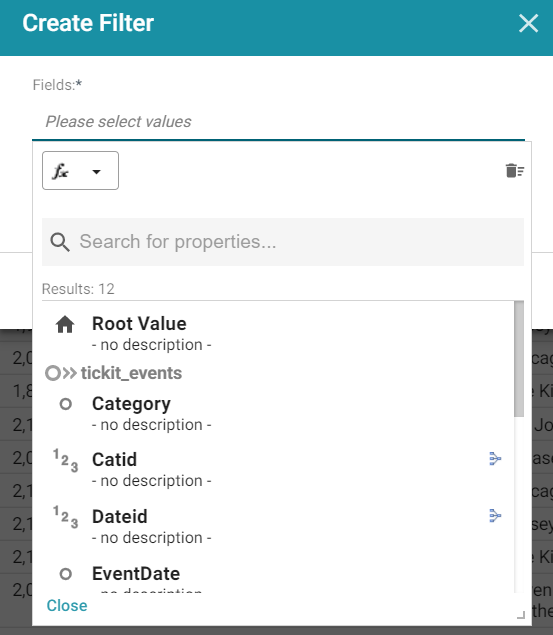
The list below describes the icons and options that are available when choosing a property:
- The Root Value (
 ) is the instance URI for the root resource—the URI for the instances of the class that was chosen as the Data Type for the Dashboard.
 To view the Root Value values, you can use the STR function to show a string representation of the URIs.
- Linked classes are represented by incoming (
 ) and outgoing (
 ) connection icons. The properties in those classes with a path to another class are denoted with a circle icon (
 ). Selecting a linked property navigates to that class and displays its properties. For this example Limit Filter, selecting the Venue path (shown below) navigates to the tickit_venues class where an integer type property, Venueseats, is selected.
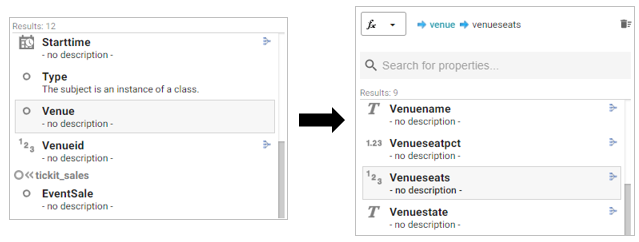
- When a property or path is selected, the breadcrumbs at the top of the dialog box show you the property path. You can click the Clear icon (
 ) to clear the path and start again.
 - After you have selected a property, you can apply a function or formula to that property to calculate the values that are displayed in the filter. To add a function, click the function button (fx) at the top of the drop-down list. The functions that become available depend on the data type of the selected property. To choose a more advanced function or type a formula, click Advanced. The Calculated Value dialog box opens and enables you to choose additional properties and functions. For more information, see Calculating Values in Lenses and Filters.
- The Root Value (
- After you have selected the property to filter on, click Close to close the Fields drop-down list.
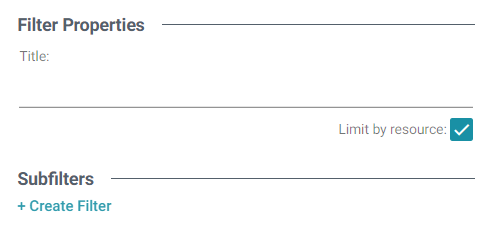
- Next, click the Filter field and select Limit from the drop-down list. The dialog box is refreshed to show the Filter Properties and other options that are available for the filter type:
- Configure any of the following properties. All of the fields are optional:
- Title: Defines the title that appears at the top of the filter when it is added to the Dashboard. If Title is blank, the value from the Fields field is used as the title.
- Limit by Resource: This setting controls whether the limit is also applied to the resource that is the Data Type of the Dashboard. When Limit by Resource is enabled, the specified limit applies to the resource as well as the property. When Limit by Resource is disabled, the limit applies only to the specified property. Using the example above for the property of Venueseats and the resource (Data Type) tickit_events, when Limit by Resource is enabled, filtering for the 5 largest values of Venueseats returns the 5 events with the largest venues. When Limit by Resource is disabled, filtering for the 5 largest venues returns all of the events that were held in one of the 5 largest venues.
- If you would like to be able to further constrain the data that appears in the filter, you can add one or more subfilters. To add a subfilter, click Create Filter under Subfilters. The process of creating a subfilter is the same as the process for the parent filter. However, the subfilter is not displayed on the Dashboard. It is visible only when editing the parent filter, and the subfilter's configuration affects only the parent filter and any sibling subfilters.
- When you have finished configuring the filter, click OK to add it to the Dashboard. The new filter appears in the left pane of the Dashboard and displays the options for configuring the limit.
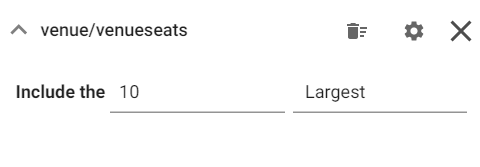
- To configure the limit for filtering data, specify a number in the Include the field. And click the drop-down list on the right to choose Largest or Smallest.
For example, the filter in the image below excludes all but the 10 venues with the most number of seats.
Changing the values in the filter refreshes the Dashboard according to the new limit.
When working with the filter on the Dashboard, the following options are available:
- Clear (): Clicking Clear removes the value in the Include the field.
- Designer (
 ): Clicking this icon opens the filter Designer so that you can view or change the filter configuration.
 - Close (X): Clicking Close removes the filter from the Dashboard. This action cannot be undone.