Navigating the Graphmart User Interface
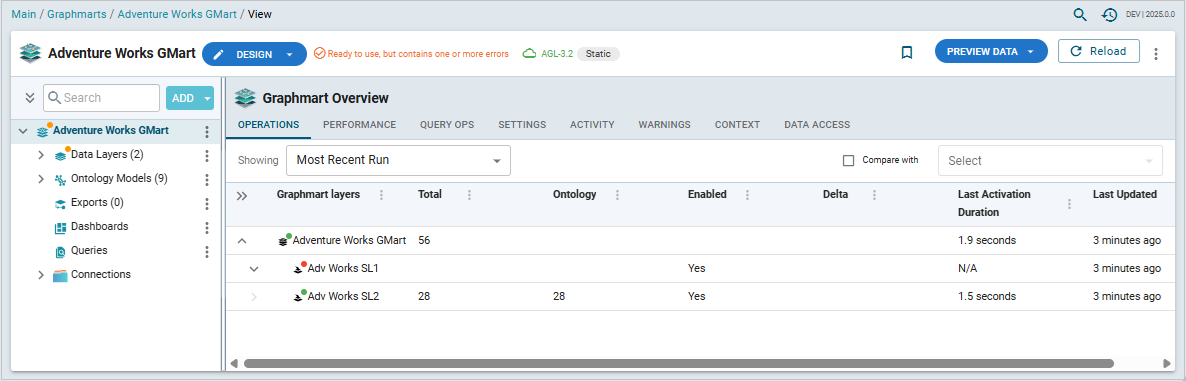
When you open a graphmart, the top-level view of the graphmart consists of two major frames: the explorer pane on the left and the Graphmart Overview frame on the right.
The explorer pane on the left-hand side shows the graphmart components in a tree structure, where the graphmart item is at the top, and its components - data layers, steps, ontology models, exports, dashboards, queries, and connections - are underneath it. As you traverse the tree and click the components and their sub-items, the composite frame on the right shows the relevant views for the selected item and context.
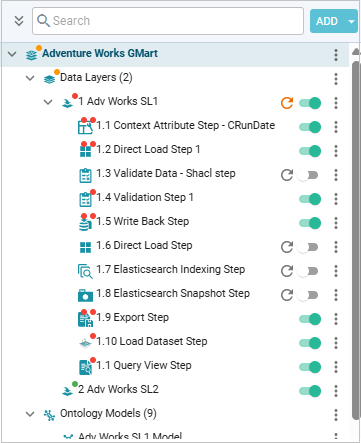
Click the arrows to the left of the components to expand them and work with the items underneath.
The menu icon (![]() ) to the right of each item provides access to the context menu for this item type.
) to the right of each item provides access to the context menu for this item type.
Where applicable, the slider control to the right of the items allows you to enable or disable them. For example, you can enable or disable individual steps underneath the layers in the explorer pane:
Expand the Exports item to view your Data on demand endpoints (OData REST endpoints),
Expand Dashboards to see references to any of the Hi-Res Analytics Dashboards that point to this graphmart, You can also create dashboards from this view.
Queries can be saved into the graphmart as a set of shared queries for that graphmart. Click the Queries item to see a filtered-down view of the query audit log for this graphmart (Graph Lakehouse connection).