Exporting a Lens
If you have dashboards with Table, Chart, and/or Query lenses, you can export those lenses from the Hi-Res Analytics application. Charts can be exported as images in JPEG, PNG, SVG, or PDF format. Tables can be exported to CSV or JSON files. And Query lenses can be exported to CSV files. Follow the instructions below to export a lens.
- Open the dashboard that contains the lens that you want to export.
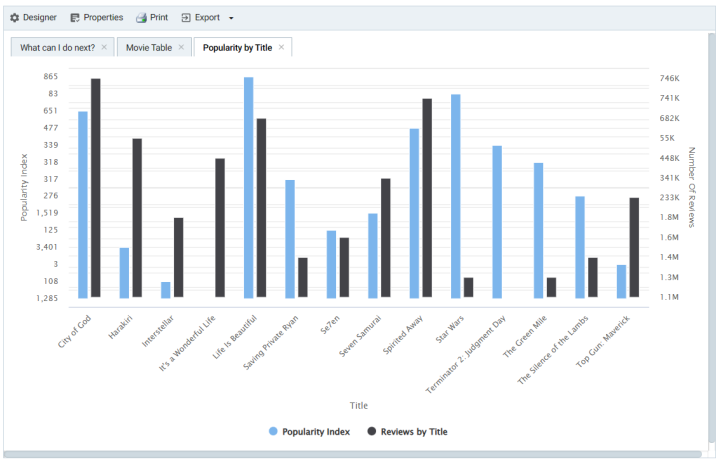
- If necessary click the tab for the lens to make it active. For example, the image below shows a chart lens.
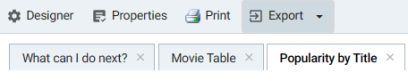
- In the object toolbar for the lens, click the Export button.
For Query lenses, adjust the Export options as needed, and then click Export Results. For example:

- If the lens is a chart, select the one of the image types from the drop-down list. Anzo creates the image as that type and downloads the file to your computer.
- If the lens is a table, the Export Options dialog box is displayed:
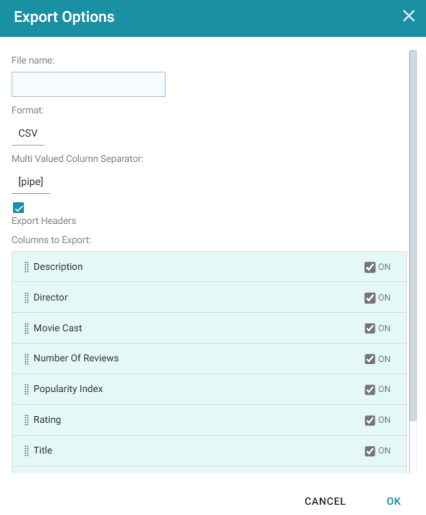
- In the Export Options dialog box, specify the following file options:
- File name: Specify a name for the file. Do not specify the file type extension.
- Format: Click the Format field and select CSV to create a .csv file or JSON to create a .json file.
- Multi Valued Column Separator: For CSV files, click this column to select the character to use as a separator in the file. This option does not apply to JSON files.
- Export Headers: Indicates whether to include column headers in the file. Clear the checkbox to exclude headers from the file. This option does not apply to JSON files.
- Columns to Export: By default, all columns are selected for export. You can clear the checkboxes next to columns that you do not want to include. In addition, you can reorder columns by dragging and dropping the rows.
- Click OK to download the file to your computer.