Enabling and Viewing AnzoGraph Query Logs
The GqeQueries Log Package listens for AnzoGraph events like connection errors, restarts, and successful and unsuccessful queries. GqeQueries is Off by default but can be enabled to monitor and log all of the queries that are sent to AnzoGraph by users through Dashboards, the Query Builder, Data Layers, etc., or sent by Anzo, such as when requesting the total number of statements in a graph.
Though GqeQueries is Off by default, AnzoGraph query errors are still captured automatically in the <install_path>/Server/logs/gqe/queriesError directory, and connection-related errors are captured in anzo_gqe_error.log.
Enabling the GqeQueries Log Package
Follow the steps below to enable the GqeQueries package.
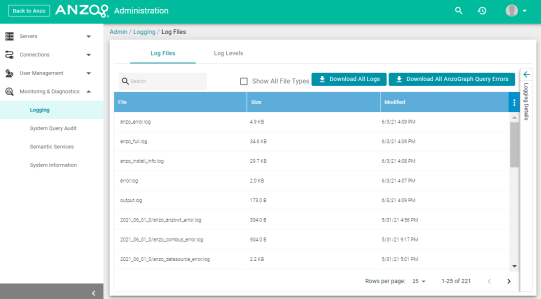
- In the Administration application, expand the Monitoring & Diagnostics menu and select Logging. The Log Files tab is displayed on the Logging screen. For example:
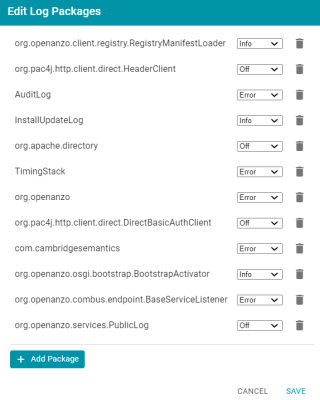
- Click the Edit button to open the Edit Log Packages dialog box.
- Click Add Package at the bottom of the screen. The Select field is displayed:
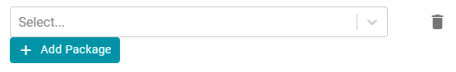
- Click the Select field and type GqeQueries. Then press Enter to add GqeQueries to the list of Log Packages. The package is added to the list with the default Log Level of Off.
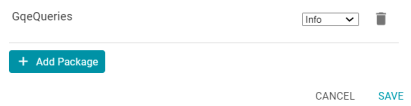
- Click the Log Level drop-down list and select Info. Then click Save to save the change.
The GqeQueries Log Package is now enabled and will start to log the events described above. The log messages for successful queries are captured in a new anzo_gqe_info.log file as well as in the <install_path>/Server/logs/gqe/queriesInfo directory on the server. Details about each request is logged to a separate file in that directory. The anzo_gqe_info.log and the files in logs/gqe/queriesInfo can be viewed and downloaded from the Administration application.
Viewing the AnzoGraph Query Logs
Follow the steps below to view the AnzoGraph log files in the application. For information about viewing logs on the server, see Viewing Logs on the Server.
- In the Administration application, expand the Monitoring & Diagnostics menu and select Logging. The Log Files tab is displayed on the Logging screen. For example:
- Click the Log Files tab to view the list of files. For example:
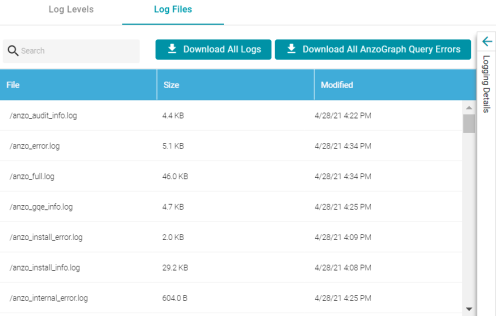
Log Packages that have the Log Level set to Error log events to files with the suffix _error. Operational information that is logged by packages that are set to Info is captured in files with the suffix _info.
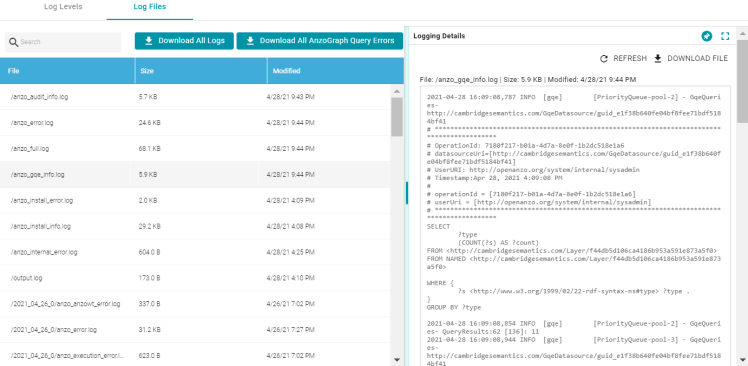
The current version of anzo_gqe_info.log is shown toward the top of the list. Earlier versions of that log are prefixed with the name of the
<date>_<part>subdirectory they are saved in. And individual query files are named as/gqe/queriesInfo/<operation_ID><epoch_timestamp>. - Select the anzo_gqe_info.log file. The contents of the file are displayed in the Logging Details section of the screen. For example:
You can expand the details view by clicking the Expand icon (
 ) in the top right corner.
The messages in anzo_gqe_info.log vary by the query source, such as whether the query originated in a Dashboard lens or the Query Builder. In general, GqeQueries Info messages contain the following information:
- Date and time the event was logged. For example,
2021-04-28 01:06:48. - The type of message, i.e., the Log Level, such as
INFO. - The type of log. For example,
[gqe]. - The area of the system or service that processed the event. For example,
[PriorityQueue-pool-2]. - The Log Package that was listening for the event, i.e.,
GqeQueries. - The Data Source URI. For example,
http://cambridgesemantics.com/GqeDatasource/guid_e1f38b640fe04bf8fee71bdf5184bf41. - The Operation ID assigned to the query. This value can be used to track the query, such as to find the individual log file in the
logs/gqe/queriesInfodirectory. For example,OperationId: 7b0op0wbzqeqe1s2d482xudkez-83. The corresponding log file is namedquery_7b0op0wbzqeqe1s2d482xudkez-83.log. - The User URI for the user who submitted the query. For example,
UserURI: ldap:///cn=Jay.Blue,ou=groups,dc=com. - If the query was submitted from the Hi-Res Analytics application, the message also includes details for identifying the dashboard and lens that submitted the request. For example:
# ex_requestDashboard = [http://cambridgesemantics.com/354db630-02b6-46b2-82d0-ef4a7543ebca]
# ex_requestSource = [http://cambridgesemantics.com/4a039bdb-bdcb-4117-830b-cb29190ce18f]
# ex_requestSourceId = [com_cambridgesemantics_application_anzoweb_lens_grid_GridLens_7]
- The text of the query that was sent by Anzo. Note that the text is the query as rewritten by Anzo and sent to AnzoGraph. It may not be the exact text that was written by the user.
- When a query returns, a result message is also added to anzo_gqe_info.log below the query text. The QueryResults message includes the Operation ID (which matches the ID from the query that was sent), and it returns the AnzoGraph and Anzo query execution time as well as the number of results returned. In the following example, the QueryResults message is shown in bold. The first value (2631) is the number of milliseconds AnzoGraph spent executing the query. The value in brackets ([13155]) is the number of milliseconds Anzo spent executing the query. And the last value (20) is the number of results that were returned.
2021-04-28 22:53:57,134 INFO  [gqe]  [PriorityQueue-pool-7] - [OpName=query]
[OpId=8tt1rrc29y31z1ga30srk6t2xx-212] [OpUser=http://openanzo.org/system/internal/sysadmin]
GqeQueries- QueryResults:2631 [13155]: 20
A QueryResults message is not logged if the query uses the Anzo cache or returns an error.
A complete example message is shown below:
2021-04-27 19:54:25,648 INFO  [gqe]  [PriorityQueue-pool-2] - GqeQueries-
http://cambridgesemantics.com/GqeDatasource/guid_e1f38b640fe04bf8fee71bdf5184bf41
# **********************************************************************************
# OperationId: 66ed1f10-5aae-45b0-861c-3a851022d294
# datasourceUri=[http://cambridgesemantics.com/GqeDatasource/guid_e1f38b640fe04bf8fee71bdf5184bf41]
# UserURI: http://openanzo.org/system/internal/sysadmin
# Timestamp:Apr 27, 2021 7:54:25 PM
#
# operationId = [66ed1f10-5aae-45b0-861c-3a851022d294]
# userUri = [http://openanzo.org/system/internal/sysadmin]
# ***********************************************************************************
SELECT
    ?type
    (COUNT(?s) AS ?count)
FROM <http://cambridgesemantics.com/Layer/f44db5d106ca4186b953a591e873a5f0>
FROM NAMED <http://cambridgesemantics.com/Layer/f44db5d106ca4186b953a591e873a5f0>
WHERE {
    ?s <http://www.w3.org/1999/02/22-rdf-syntax-ns#type> ?type .
}
GROUP BY ?type
2021-04-27 19:54:25,670 INFO  [gqe] [PriorityQueue-pool-2] - GqeQueries-
QueryResults:16 [100]: 11