Data Profiling Metrics
When a Data Profile is generated for a Data Source, Dataset, or Graphmart, Anzo runs several metrics that can help users measure data quality and perform data discovery at the class, property, and instance level. The Data Profile metrics are grouped into two categories: a Primary category that focuses on data quality type analysis, and an Advanced category that includes the Primary data quality analytics plus several advanced metrics for deeper data discovery and analysis.
The lists below give a summary of the Primary and Advanced metrics. For more information and sample images of the visualizations that are generated, click a metric name.
Primary
- Row Count: Reports the total row (instance) count per class.
- Property Count: Reports the total number of properties per class.
- Absent Property: For each property, reports the total number of instances that do not have a value.
- Empty Property: For each string property, reports the total number of empty strings.
- Sample Values: Returns sample values for each property.
- Average: For each numeric property, computes the average of all values.
- Sum: For each numeric property, computes the sum of all values.
- Average String Length: For each string property, computes the average length of the strings.
- Value Present: For each property, computes the percentage of instances that have at least one value.
- Unique Pattern Count: For each property, counts the total number of unique value patterns.
- Unique Values Count: For each property, counts the total number of unique values.
- Median: For each numeric property, computes the median of all values.
- Standard Deviation: For each numeric property, computes the standard deviation of all values.
- Mode: For each numeric property, computes the mode of all of the values.
- Presence: For each property in a class, reports the percentage of instances that have values vs. do not have values.
- Top Value Counts: For each property, computes the top N most occurring values.
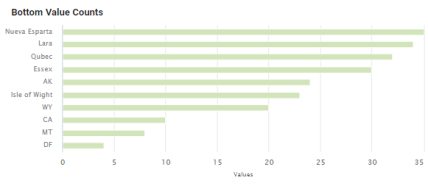
- Bottom Value Counts: For each property, computes the N least occurring values.
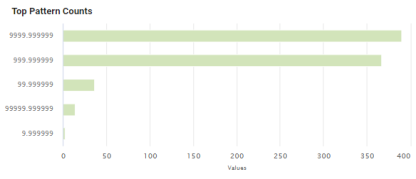
- Top Pattern Counts: For each property, computes the top N most common value patterns.
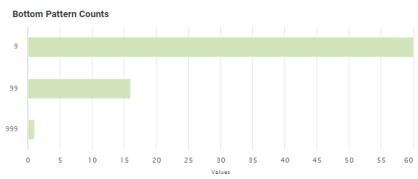
- Bottom Pattern Counts: For each property, computes the N least common value patterns.
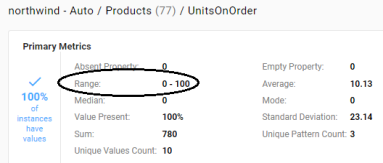
- Range: For numeric properties, reports the total range of values.
- Value Types: For each property, returns the data types for the instances.
- DateTime Distribution By Year/Month/Day: For dateTime properties, computes a histogram that shows the distribution of values by year, month, and day.
Advanced
- Pearson Skewness: For each numeric property, computes the Pearson coefficient of skewness.
- Geometric Mean: For each numeric property, computes the geometric mean of all values.
- Variance: For each numeric property, computes the variance of all values.
- Discrete Entropy: For each property, computes the discrete entropy of all values.
- Discrete Probability: For each property, computes the discrete probability of all values.
- String Length Range: For each string property, reports the range of string lengths.
- Unique Values: For each property, computes the percentage of unique values.
- Lower Case Strings: For each string property, computes the percentage of values with all lower case characters.
- Upper Case Strings: For each string property, computes the percentage of values with all upper case characters.
- Trivial Values: For each string property, computes the percentage of instances that have one of the following values: NA, N/A, NONE, or NULL.
Row Count
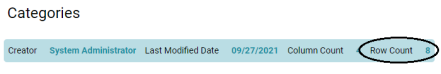
This metric computes the total row count per class. For Source profiles, the Row Count is displayed at the top of the screen under the class name. For example:
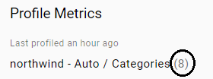
For Dataset and Graphmart profiles, the row count is in parenthesis at the top of the screen next to the class name, as shown in the image below.
Property Count
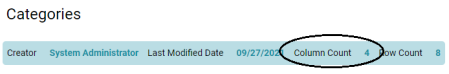
This metric computes the total number of properties per class. For Data Source profiles, the property count is labeled Column Count, as shown in the following image.
For Dataset and Graphmart profiles, the property count is not shown.
Absent Property
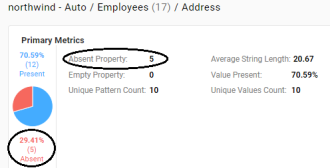
For each property, this metric reports on the total number of instances that do not have a value for that property.
Empty Property
For string properties, this metric reports the total number of empty strings.
![]()
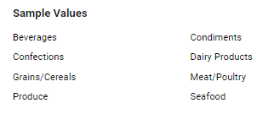
Sample Values
This metric returns sample values for each property.
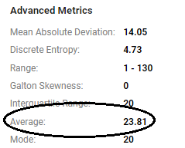
Average
For each numeric property, this metric computes the average of all values.
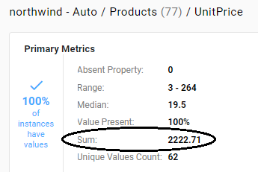
Sum
For each numeric property, this metric computes the sum of all values.
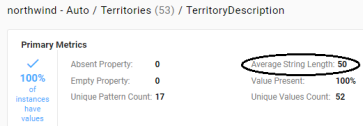
Average String Length
For each string property, this metric computes the average length of the values.
Value Present
For each property, this metric computes the percentage of instances that have at least one value.

Unique Pattern Count
For each property, this metric counts the total number of unique value patterns.
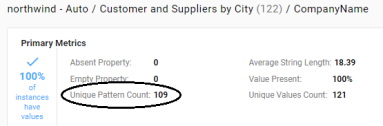
Unique Values Count
For each property, this metric counts the total number of unique values.
![]()
Median
For each numeric property, this metric computes the median of all values.
![]()
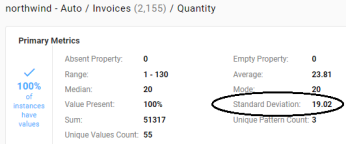
Standard Deviation
For each numeric property, this metric computes the standard deviation of all values.
Mode
For each numeric property, this metric computes the mode of all of the values.
![]()
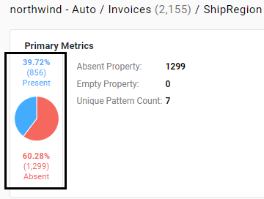
Presence
The metric is available when viewing a class. For each property in the class, this metric reports on the percentage of instances that have values and the percentage of instances that do not have values.
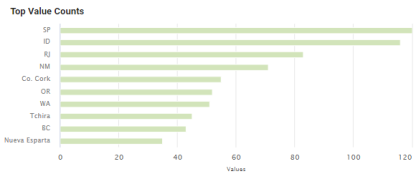
Top Value Counts
For each property, this metric computes the top N most occurring values.
Bottom Value Counts
For each property, this metric computes the N least occurring values.
Top Pattern Counts
For each property, this metric computes the top N most common value patterns.
Bottom Pattern Counts
For each property, this metric computes the N least common value patterns.
Range
For numeric properties, this metric computes the range of all values.
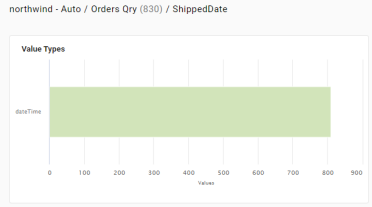
Value Types
For each property, this metric returns the data types for the instances.
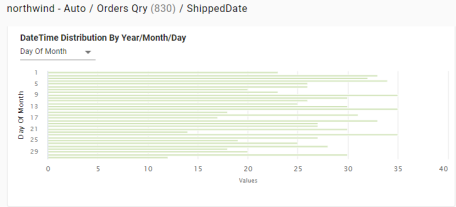
DateTime Distribution By Year/Month/Day
For each dateTime property, this metric computes a histogram that shows the distribution of values by year, month, and day.
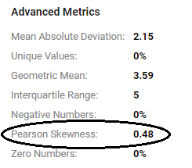
Pearson Skewness
For each numeric property, this metric computes the Pearson coefficient of skewness to show the distribution of values. A value of 0 indicates no skew, a positive number indicates positive skew, and a negative number indicates negative skew.
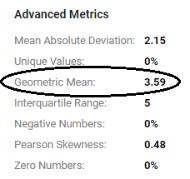
Geometric Mean
For each numeric property, this metric computes the geometric mean of all of the values.
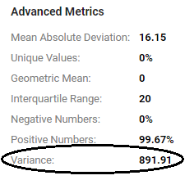
Variance
For each numeric property, this metric computes the variance of all values.
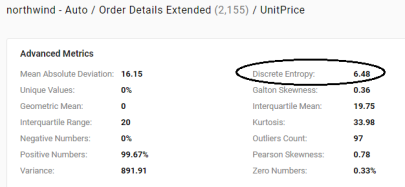
Discrete Entropy
For each property, this metric computes the discrete entropy of all values.
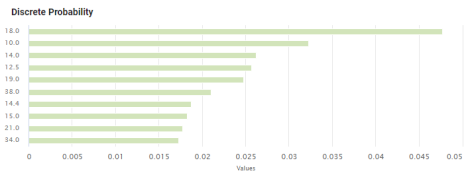
Discrete Probability
For each property, this metric computes the discrete probability of all values.
String Length Range
For each string property, this metric reports the range of string value lengths.

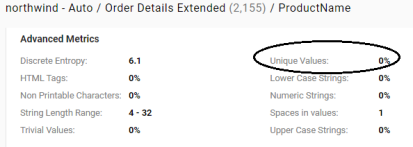
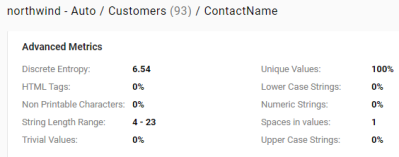
Unique Values
For each property, this metric computes the percentage of unique values.
Lower Case Strings
For each string property, this metric computes the percentage of values that have all lower case characters.
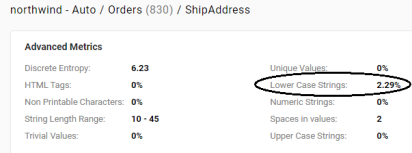
Upper Case Strings
For each string property, this metric computes the percentage of values that have all upper case characters.
![]()
Trivial Values
For each string property, this metric computes the percentage of instances that have one of the following values: NA, N/A, NONE, or NULL.
For additional metrics based on the type of data quality checks needed, contact Cambridge Semantics.