Creating a Custom Endpoint
Follow the instructions below to create a Custom Data on Demand endpoint (sometimes called a Table endpoint). Creating a custom endpoint is similar to creating a dashboard Table lens in that you build a table with the columns that you want to see. You can traverse the relationships and join classes, add filters, and apply functions to properties. The tables are translated to SPARQL queries that create views in AnzoGraph, allowing you to interact with the graph for complex analytics but generate results in the tabular format that BI tools expect.
- In the Anzo application, expand the Blend menu and click Graphmarts. Anzo displays a list of the existing graphmarts. For example:
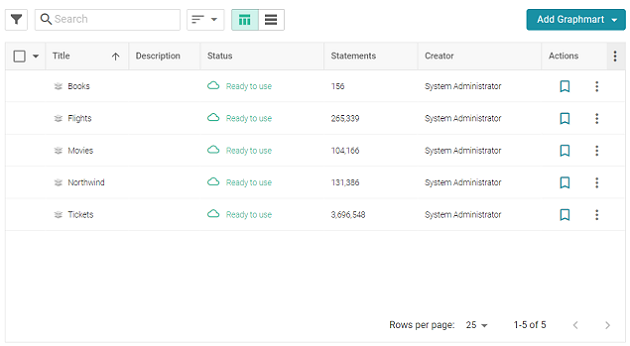
- On the Graphmarts screen, click the name of the graphmart for which you want to create an endpoint.
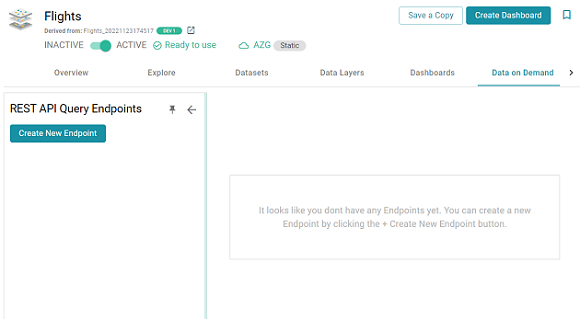
- Click the Data on Demand tab. Anzo displays the Data on Demand screen, which lists any existing endpoints. For example, the image below shows a graphmart without any endpoints:
- Click the Create New Endpoint button on the left side of the screen. Anzo displays the Create REST API Query Endpoint screen:
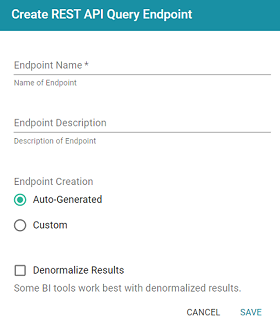
- Configure the endpoint options on the screen as needed. The list below describes each setting:
- Endpoint Name: Specify a name for the endpoint in this field. The endpoint name must be unique.
- Endpoint Description: You can add an optional description for the endpoint in this field.
- Endpoint Creation: This field specifies the type of endpoint to create. By default, the type is set to Auto-Generated. Select the Custom radio button.
- Denormalize Results: By default (when Denormalize Results is not selected), OData returns multi-valued properties as arrays. Certain BI tools, however, do not support arrays or multi-valued properties. If your data includes multi-valued properties and you plan to view the endpoint using a BI tool that does not support them, you can select the Denormalize Results setting to denormalize all multi-valued properties that are exposed in the endpoint. For JSON, XML, and CSV output formats, denormalization expands the properties into new rows so that they can be viewed in BI tools.
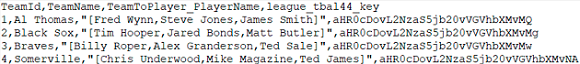
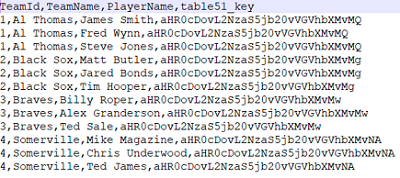
The following image shows an example of CSV output of multi-valued properties when Denormalize Results is disabled:
And the example below shows the output of multi-valued properties when Denormalize Results is enabled:
For Custom endpoints, you also have the option to denormalize data on a per-column basis. If you do not want to denormalize all multi-valued properties, you can leave Denormalize Results disabled and then enable denormalization for specific columns when you build the endpoint views.
Also note that denormalizing all results means that more rows are created and transferred. Depending on the number of multi-valued properties and how the data is set up, you may see slower performance when creating and querying denormalized endpoints.
- When you have finished configuring the endpoint options, click Save. The endpoint is created and is empty until you create queries. For example, the image below shows a new endpoint:
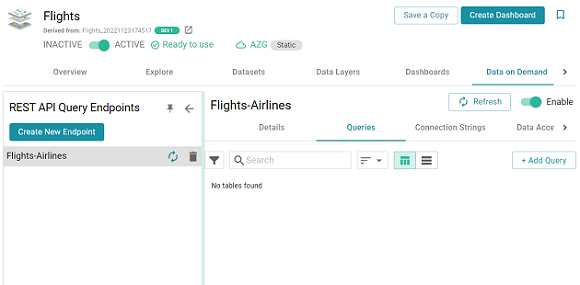
By default the endpoint is set to Enable, indicating that the endpoint is active. If you want to disable the endpoint, slide the Enable slider to the left.
If a request is sent to a disabled endpoint, Anzo displays a
503: Service Unavailableerror with a message indicating that the endpoint is disabled. For example, "Unable to process request. The endpoint '<name>' is DISABLED." - (Optional) You can click the Details tab to make changes to any of the following additional configuration options that become available after the endpoint is initially created:
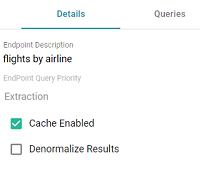
- Endpoint Query Priority: This setting controls where in Anzo's query queue the generated SPARQL queries for this endpoint are placed for processing, i.e., the priority for executing queries against this endpoint versus other types of queued queries like data layer and dashboard queries. By default, Endpoint Query Priority is set to Extraction, which is priority level 3 out of 8. The options are Interactive = 1, Extraction = 3, and Batch Process = 8.
- Cache Enabled: When the endpoint is accessed, Anzo translates the OData query to a SPARQL query and sends it to AnzoGraph for execution. The Cache Enabled setting controls whether the results of that AnzoGraph query are cached in Anzo so that subsequent endpoint requests can run against the cache in Anzo. When Cache Enabled is selected (the default setting), Anzo stores the cached results and AnzoGraph only gets queried if the cached results are invalidated and need to be refreshed. When Cache Enabled is disabled, Anzo does not store the cache, and endpoint requests are sent to AnzoGraph.
- To start building a view, click the Queries tab (if necessary), and then click the Add Query button. The New Query dialog box is displayed.
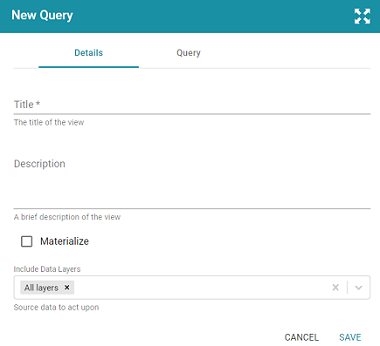
- On the Details tab, configure the following options as needed:
- Title: Type a name for the table in the Title field. The name must be unique for the endpoint.
- Description: You can add an optional description for the view in this field.
- Materialize: If you want to store a copy of the data that this view creates (materialize the data), select the Materialize check box. When this option is disabled AnzoGraph creates a virtual view where only the view definition is stored in memory and not a copy of the data. If a request is made against this view, AnzoGraph temporarily materializes the data in memory, performs the query operations, and then drops the temporary data.
- Include Data Layers: By default, the Include Data Layers option is set to include All Layers. If you do not want the query to target the source data in all layers, select the field and choose alternate layers from the drop-down list.
- Click the Query tab to start building a table.
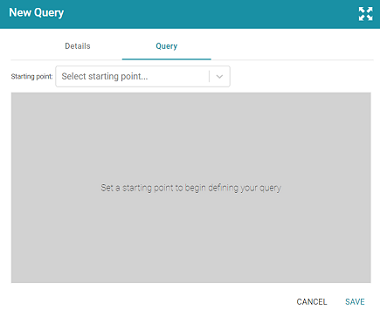
- On the Query screen, get started by selecting a class to use as the starting point. Click the Select Starting Point drop-down list and select a class. Once you select the class, the Add Column button is displayed.
- Click Add Column to create a column in the table. The Add Column dialog box is displayed:
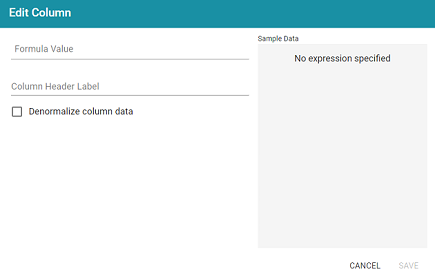
- On the Add Column screen, configure the following options as needed:
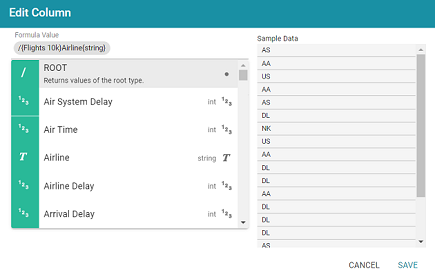
- Formula Value: Click this field to choose the column header. Like building columns in a dashboard table, you can navigate the relationships to join data from different classes, and you can apply functions to the values. When you click the field and start to select paths and properties, sample data is shown on the right side of the screen. For example:
- Column Header Label: This is the label that you want to use for displaying the Formula Value.
- Denormalize column data: If you enabled Denormalize Results at the endpoint level, leave this setting disabled. If Denormalize Results is disabled at the endpoint level, you can enable this setting to denormalize the values for this column only.
If you do not denormalize the data, you can use the Format tab to specify the character to use for separating the values in the arrays that are returned for multi-valued properties. By default, the Value Separator is set to comma (,). The Format tab becomes available after saving the column.
- Formula Value: Click this field to choose the column header. Like building columns in a dashboard table, you can navigate the relationships to join data from different classes, and you can apply functions to the values. When you click the field and start to select paths and properties, sample data is shown on the right side of the screen. For example:
- Click Save to add the column to the table.
- Add new columns to the table by clicking Add Column. You can change the order of columns by dragging a column up or down, and you can enable or disable columns by sliding the slider for the column. Click the menu icon (
 ) for a column to edit or delete that column.
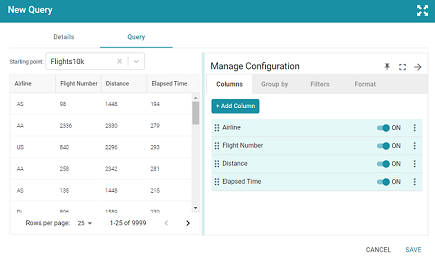
- If you would like to group by clause, you can click the Group By tab and select the column or columns to group.
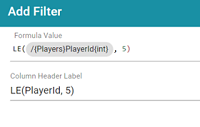
- If you would like to filter out some data, you can add one or more filters to the overall query. To add a filter, click the Filters tab and then click Add Filter. In the Formula Value field, specify the formula to use to determine which values should be included in the results. Then specify a name for the column in the Column Header Label. For example, the filter below is configured to include only the results where the Player ID is less than or equal to 5.
- Once you are satisfied with the configuration, click Save to create the endpoint.
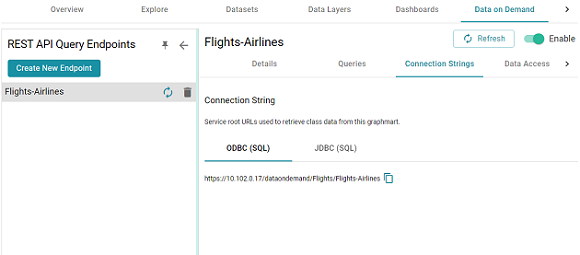
This endpoint is ready for access via OData/ODBC or JDBC. On the Connection Strings tab for the endpoint, retrieve the ODBC or JDBC service URL to use to access the endpoint. For example:
To test whether the endpoint is active, you can copy the ODBC service URL and paste it into a web browser.
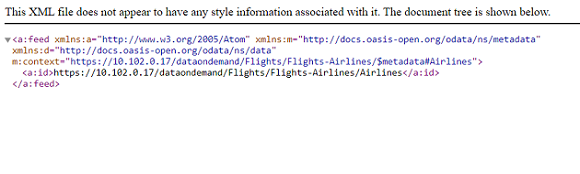
After pasting the URL into the browser, add the table name to the end of the string. The URL for a Custom endpoint is <ODBC_or_JDBC_URL>/<table_name>. For example, if the ODBC URL is https://10.10.0.11/dataondemand/Flights/Flights-Airlines, and the table name is Airlines, the connection string is https://10.10.0.11/dataondemand/Flights/Flights-Airlines/Airlines.
If the endpoint is active, the browser shows an XML feed of the data. For example:
The endpoint is accessible only when it is Enabled and the associated graphmart is Active.
For information about accessing endpoints programmatically, see Accessing an Endpoint Programmatically. For information about accessing endpoints with third-party analytics tools, see Accessing an Endpoint from an Application. For information about the supported OData operators, output format, and query examples, see OData Reference.