Configuring a Dashboard to Update in Batch Reporting vs. Interactive Mode
Dashboards are configured to run in interactive mode by default. In interactive mode, Anzo updates dashboards automatically each time a user adds, selects, or modifies a filter or lens. Each change generates one or more SPARQL queries that are run against the graphmart data in AnzoGraph. Depending on conditions such as the number of concurrent users, the size of the data, the number of filters, and/or the complexity of the calculations, running in interactive mode can result in significant server workloads, as many complex queries are executed simultaneously. If dashboard performance becomes unsatisfactory, there are two options for changing how and when a dashboard is updated:
- You can configure a dashboard to run in "Reporting" mode. Dashboards in reporting mode are not refreshed immediately with every change. Instead, update queries are paused until a user completes their changes and manually initiates the update process. The update refreshes all of the lenses and filters on the dashboard.
- For finer-grained control over which lenses and filters are updated automatically and which are not, you can enable update controls on each lens and filter. Adding update controls does not change the update method for the entire dashboard, but certain components can be paused and then updated individually.
By default, dashboards are also automatically refreshed when the data in the backing graphmart changes. The Automatic setting in the Refresh menu controls this behavior. When Automatic is disabled and the graphmart is updated, the user is informed that the data changed and they can manually refresh the dashboard to get the updates.
This topic provides instructions for changing the update method at the dashboard level and enabling update controls so that lenses can be updated individually.
Changing the Update Method for a Dashboard
- Open in the Hi-Res Analytics application the dashboard that you want to change.
- In the main toolbar, click Designer to open the dashboard designer. For example:
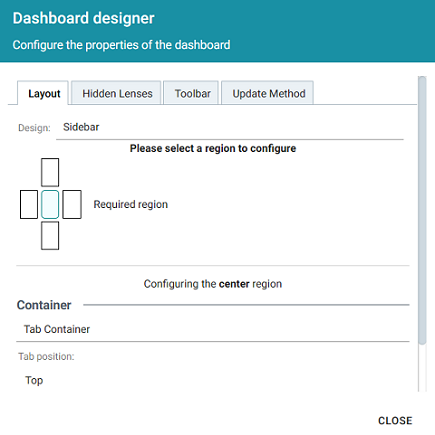
- In the designer, click the Update Method tab. The image below shows the Update Method tab for a dashboard that is in Interactive mode.
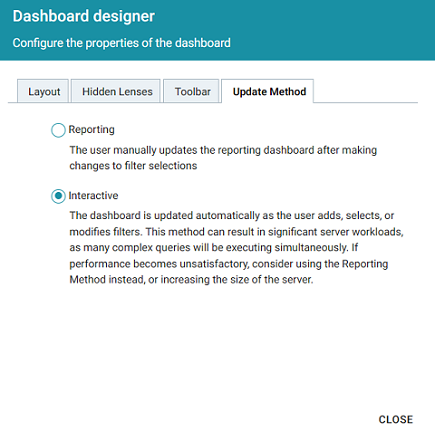
- Click the radio button for the update mode that you want the dashboard to use. Then click Close to close the designer.
- Save the dashboard to save the configuration change.
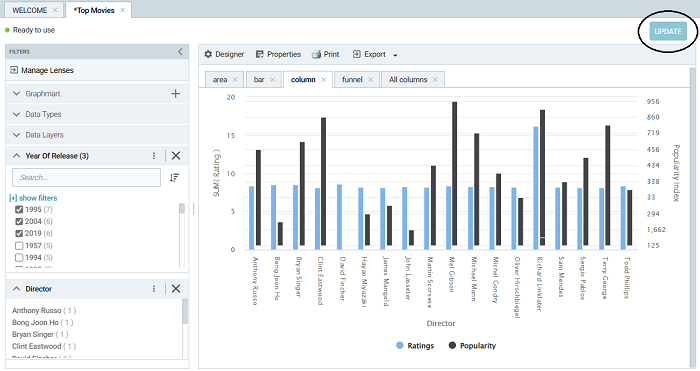
When a dashboard is in Reporting mode, an Update button is displayed on the top right corner of the dashboard. The button is disabled when the dashboard is up to date. The image below shows the disabled button.
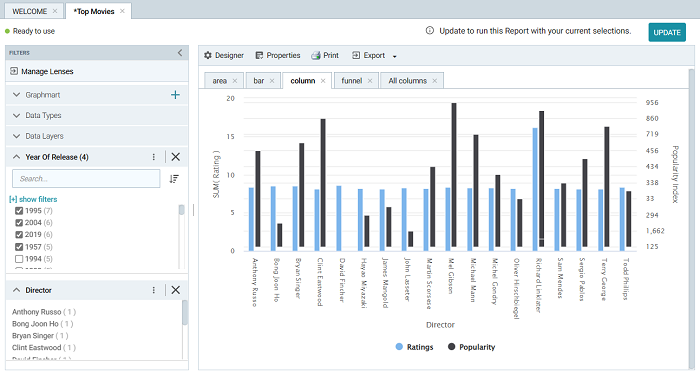
When a user makes a change to a component, the Update button is enabled (as shown in the image below) and the dashboard can be refreshed as needed. When the update is initiated, all lenses are refreshed.
Adding Manual Update Controls to Lenses and Filters
- Open in the Hi-Res Analytics application the dashboard that you want to change.
- In the main toolbar, click the Refresh menu and select Show Update Controls. A pause icon and status icon are added to each filter and lens on the dashboard, as shown in the image below.
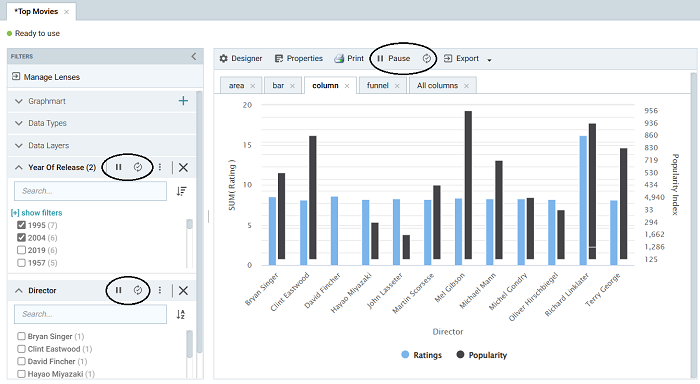
The pause icon (
 ) is used to pause or re-enable automatic updates of the component, and the status icon indicates whether the component is up-to-date (
 ) or out of sync (
 ).
). - Save the dashboard to save the configuration change.
- In the dashboard, click the pause icon for any filters and lenses that you do not want to be updated automatically.
When a filter or lens is paused and a user makes an update that affects that component, an update message is displayed. For example, the image below shows a lens and filter that are out of sync. Clicking UPDATE in the message refreshes that component.
