Generating a Dataset Data Profile
Similar to generating a profile for a graphmart, you can generate a data profile for a dataset in the Datasets catalog. Generating a dataset profile helps users perform data discovery, assess the quality of the onboarded data, and decide whether to use the dataset in a graphmart. The reports can also assist users in determining the types of data layer steps to create and writing the queries to include in the steps.
To generate a dataset data profile, AnzoGraph must be online. If you have dynamic AnzoGraph deployments enabled, AnzoGraph will be provisioned automatically when the profile is generated.
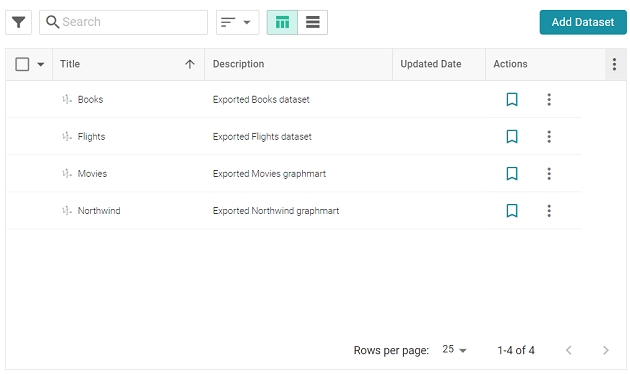
- In the Anzo application, expand the Blend menu and click Datasets. Anzo displays the Datasets screen, which lists the catalog of datasets. For example:
- On the Datasets screen, click the name of the dataset that you want to generate a profile for. Anzo displays the Explore tab for the dataset. For example, the image below shows a dataset for which a data profile has not been generated and the class and property counts are 0:
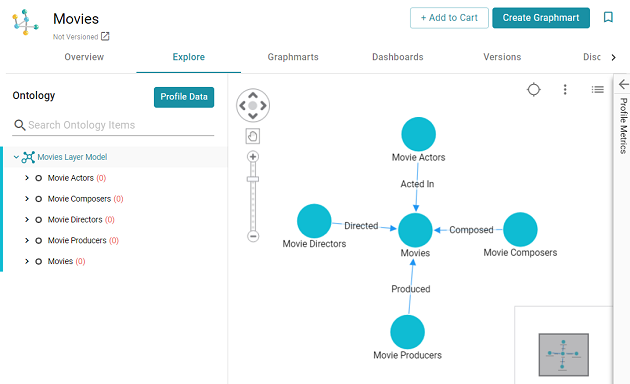
- Click the Profile Data button on the left side of the screen. The Data Profile dialog box is displayed::
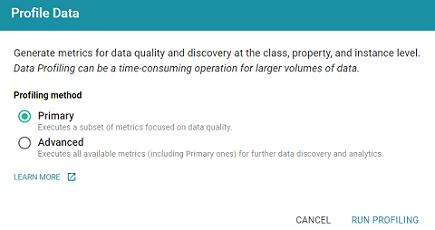
- On the Data Profile screen, choose the Profiling Method to use. The Primary method focuses on data quality type analysis. The Advanced method includes the Primary data quality analytics plus several advanced metrics for deeper data discovery and analysis. For details about the Primary and Advanced metrics, see Data Profiling Metrics.
To run the Advanced metrics, the optional AnzoGraph C++ extensions and dependencies must be installed. If you use dynamic, K8s-based deployments of AnzoGraph, the extensions are included. If you installed a static AnzoGraph instance with the installer, the C++ extensions are optional and are only installed if yes was specified for the
Do you want to install C++ UDXs packaged with AnzoGraph DB?prompt. For information about the C++ dependencies, see Install the Optional C++ Extension Dependencies. - Click Run Profiling to start generating the profile.
If the dataset is used in a graphmart that is active, Anzo displays the Select Graphmart dialog box (shown below), which prompts you to choose whether the online dataset can be used for running the profiling queries or whether to provision another temporary graphmart for the dataset.
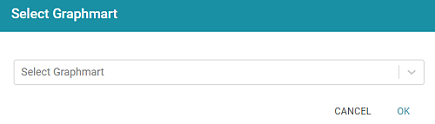
To use the dataset in the graphmart that is online, click the Select Graphmart drop-down list and select the graphmart name. If you want Anzo to provision a temporary graphmart instead, select Don't reuse the Graphmart.
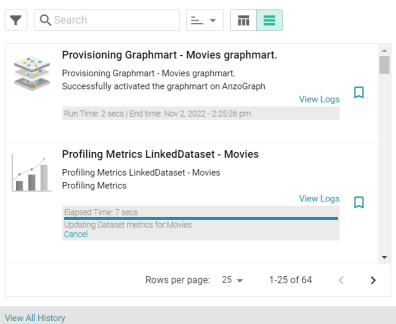
The profiling process may take several minutes, especially for large volumes of data. You can check the status of the process in the Activity Log. The Activity Log also presents the option to stop the profiling process by clicking Cancel under the progress bar for the task. For example:
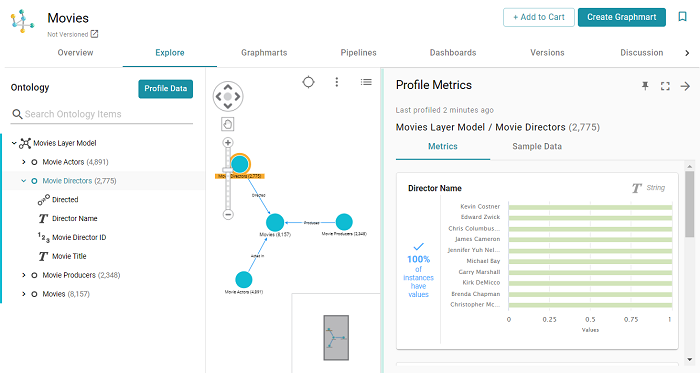
- Once the profiling is complete, the Profile Metrics panel is expanded on the Explore tab. To populate the panel, click a class or property in the ontology or a class in the graph view in the middle of the screen. For example:
You can click the Expand icon (
 ) on the right side of the screen to collapse the graph view and expand the metrics view.
Select any class or property to view its metrics. For details about each of the metrics that are run, see Data Profiling Metrics.