Creating a Table Lens
Table lenses display data in a standard column and row grid layout. Follow the steps below to create a table lens.
The list below describes the default display formats for date and numeric values in tables.
- Date: By default Anzo displays date values in "short" date format. The order of the month, day, and year depends on the location of your browser. For example, in the United States the default date format is
MM/DD/YYYY. In Australia, the default date format isDD/MM/YYYY. Note that this is not dependent on the Anzo server location but on the location auto-detected by the browser. - Numeric: Anzo displays the complete value without a limit on precision. Numeric formats are also dependent on the location of the browser. For example, in the United States the default format for a large number is
4,294,967,295.00and in Canada the default format is4 294 967 295,000.
- In the dashboard that you want to add a lens to, click Lenses in the main toolbar and select New. The Create Lens dialog box is displayed:
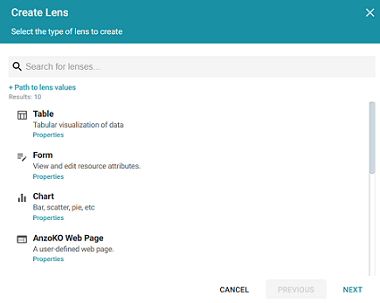
- On the Create Lens dialog box, select Table, and then click Next. Anzo displays the General Information dialog box.
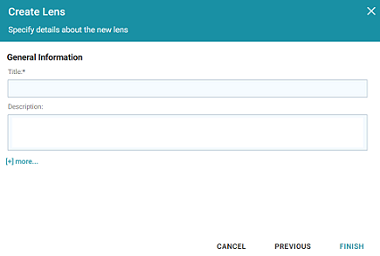
- Type a Title and optional Description for the lens.
- Click Finish. The lens Designer dialog box is displayed so that you can configure the lens.
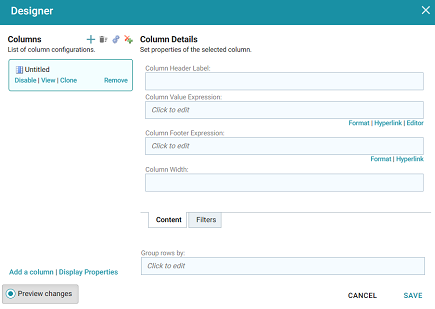
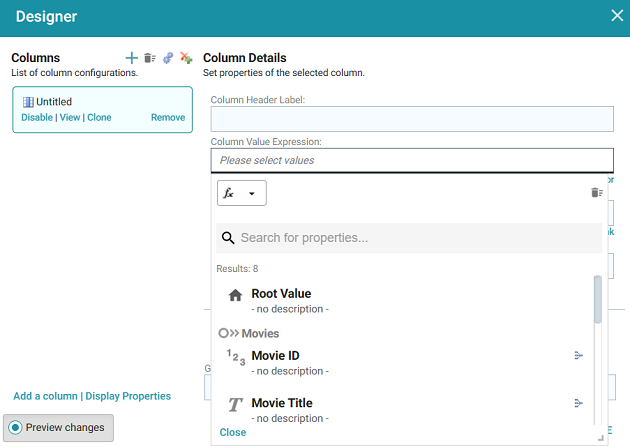
- To add a column to the table, click the Column Value Expression field and select the property name or calculation to use to populate the values in the column. For information about calculating values, see Calculating Values in Lenses and Filters.
As a shortcut to browse the available columns, you can click the Auto-generate columns icon (
 ) to add all properties (for the data type selected on the dashboard) as columns. Then you can hover the pointer over columns to remove the ones you do not want to keep. For example:
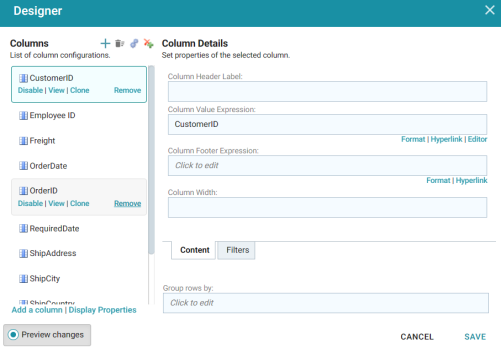
- You have the option to create a filter or configure any of the following optional fields:
- Column Header Label: The column name to display. Overrides the Column Value Expression property name.
- Column Footer Expression: The property to use to supply the table footer.
- Column Width: The width of the column in pixels.
- Group rows by: The property to group data by.
- Filters Tab: You can click Create filter to add a filter on the column. For more information, see Working with Filters.
- Click Save to save the configuration and add the lens to the dashboard.