Using the Admin Console
This topic applies to AWS CloudFormation (CFN), Docker, and Kubernetes deployments and provides instructions for logging in to and using the AnzoGraph Admin Console.
| Note | The Admin Console is not available by default for RHEL/CentOS tarball deployments. For instructions on deploying the user interface, see Deploying the User Interface. |
For instructions on using the Admin Console to upgrade a license, see Upgrading an AnzoGraph License.
- Logging in to the Admin Console
- Starting and Stopping AnzoGraph
- Viewing the Named Graphs in the Database
- Viewing Running Queries and Query History
- Retrieving Diagnostic Files
Logging in to the Admin Console
| Note | The AnzoGraph console supports the latest Safari, Google Chrome, and Mozilla Firefox browsers. Microsoft Edge and Internet Explorer are not supported at this time. |
- Depending on whether you deployed AnzoGraph using the Docker,
Kubernetes with Helm, or AWS CloudFormation options,
follow the appropriate instructions below to access the user interface:
- Docker Desktop for Mac or Windows: You can use the Docker Dashboard to open the AnzoGraph container in a browser, or open a browser and go to the following URL:
http://127.0.0.1
If you specified a port other than 80 for the host HTTP port when you deployed AnzoGraph, include that port in the URL. For example, http://127.0.0.1:8888.
- Docker on Linux: If you are accessing Docker on a remote Linux host, note the IP address of the host, and then open a browser and go to the following
URL:
https://host_IP_address
If you mapped the container's HTTPS (8443) port to port 443 on the host when you deployed AnzoGraph, you do not need to specify a port. If you specified a port other than 443, include the port in the URL. For example,
https://10.100.0.1:8888.Note If you are using Docker locally on a Linux machine and need to know the IP address of the AnzoGraph container, you can run the following command: sudo docker inspect container_name | grep '"IPAddress"' | head -n 1
For example:
sudo docker inspect anzograph | grep '"IPAddress"' | head -n 1
"IPAddress": "172.17.0.2"
- Kubernetes with Helm deployments: Using the AnzoGraph Cluster IP or External IP from
the
kubectl get servicecommand, open a browser and go to the following URL:https://IP_address
- AWS CloudFormation deployments: In the Outputs section of the Stack Detail screen, click an AnzoGraph endpoint URL (AnzoGraphURL) to open the AnzoGraph Console.
Note: If you use the HTTPS endpoint, your browser may warn you that the connection is not private. The warning is normal behavior. AnzoGraph servers use self-signed certificates, and browsers automatically trust only the certificates from well-known certificate authorities. For more information about certificate warnings, see Security Certificate Errors on the DigiCert website. Depending on your browser, follow the appropriate instructions below to either bypass the warning and continue to the console or configure the browser to trust the certificate:
- On Chrome, click the Advanced link at the bottom of the page and then click the Proceed to ip (unsafe) link.
- On Safari, click the Show Details button and then click Visit Website to import the certificate.
- On Firefox, click Advanced and then click Add Exception. On the next screen, click Add Security Exception to confirm the exception for the AnzoGraph endpoint.
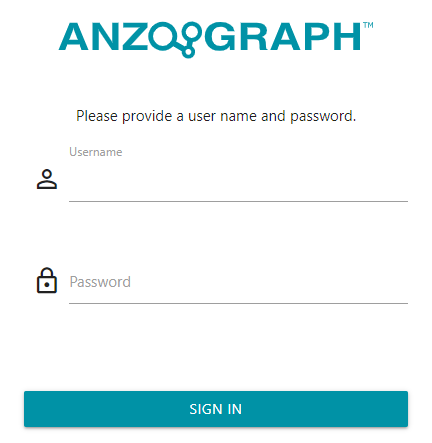
The browser displays the AnzoGraph log in screen.
- Docker Desktop for Mac or Windows: You can use the Docker Dashboard to open the AnzoGraph container in a browser, or open a browser and go to the following URL:
- On the log in screen, type admin as the user name and Passw0rd1 as the password, and then click Sign In.
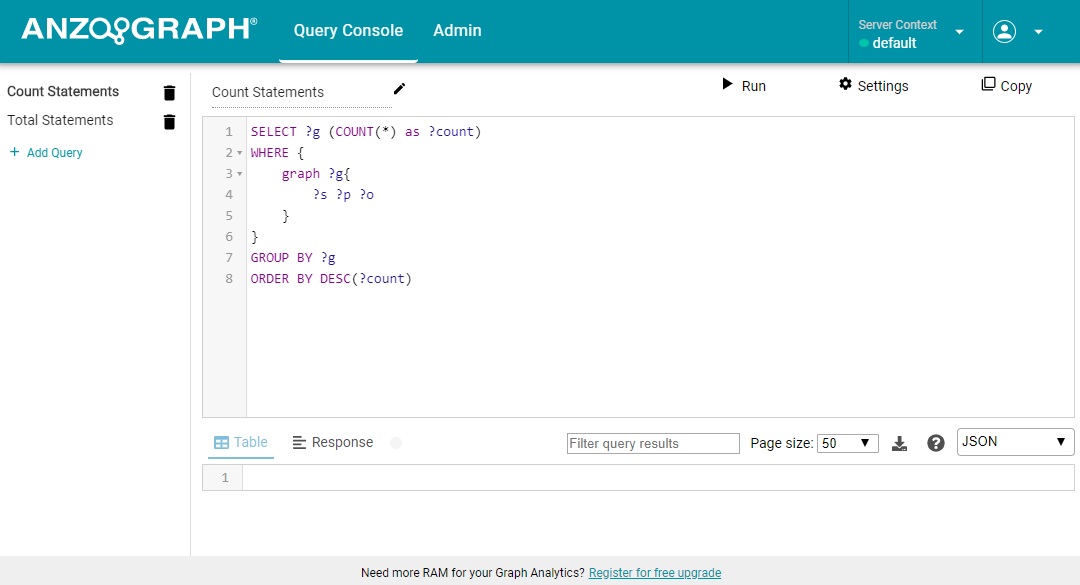
The Query Console opens.
- Click the Admin tab. AnzoGraph shows information for the General menu selection in the Admin Console display. For example:
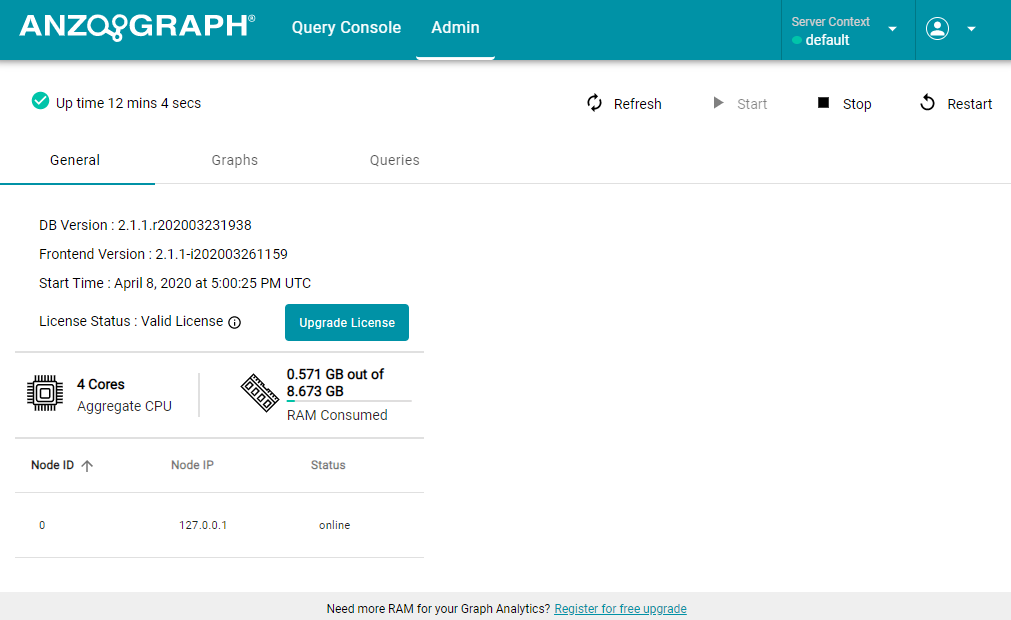
The General tab selection displays the database and console version information, database start time, and license status. It also provides details such as the number of cores utilized on the AnzoGraph server or cluster, memory usage, and total memory resources available to AnzoGraph. For instructions on upgrading the license, see Upgrading an AnzoGraph License.
Starting and Stopping AnzoGraph
The Stop, Start, and Restart buttons at the top of the Admin screens enable users to stop, start, or restart AnzoGraph:
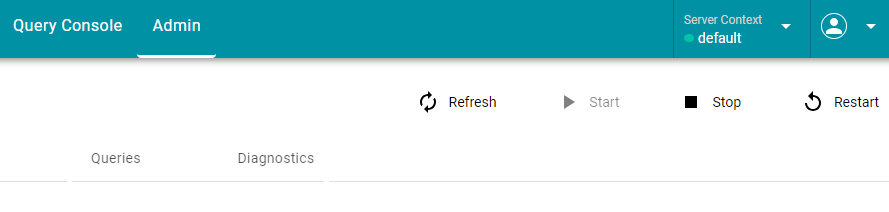
In addition, the Refresh button refreshes the screen in the browser.
Viewing the Named Graphs in the Database
You can use the Admin Console to view a list of all of the named graphs in AnzoGraph. To view the list, log in to the Admin Console and click the Graphs tab. The console displays a list of the graphs in memory as well as a count of the number of triples that each graph contains. For example:
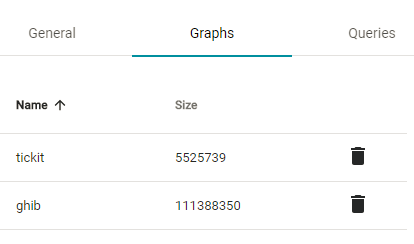
If you want to delete a graph from the database, click the trashcan icon (![]() ) in the row for the graph that you want to drop. The console displays a dialog box to confirm that you want to delete the graph. Click OK to remove the graph.
) in the row for the graph that you want to drop. The console displays a dialog box to confirm that you want to delete the graph. Click OK to remove the graph.
Viewing Running Queries and Query History
The Admin Console provides access to the query history log, which shows a list of the queries that have been run against AnzoGraph. To view the list, log in to the Admin Console and click the Queries tab. The screen shows the query history and provides the option to cancel all running queries. For example:
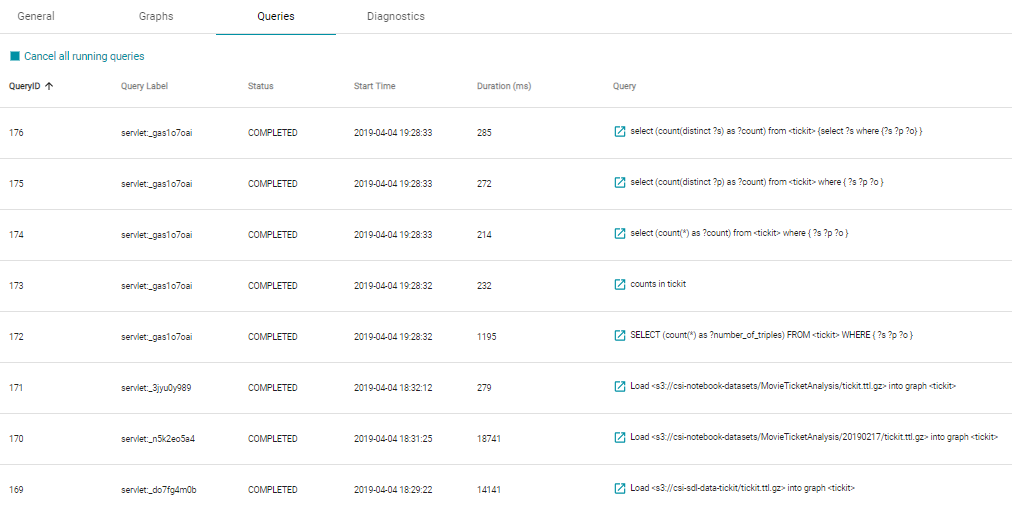
For each query, the screen shows the query ID, label, and status as well as the start time and duration in milliseconds. The last column shows the query text. You can click the new window icon ( ) next to a query to copy that query into the Query Console where you can edit and/or re-run the query.
Retrieving Diagnostic Files
When Cambridge Semantics Support requests AnzoGraph diagnostic files for troubleshooting an issue, you can quickly retrieve the files from the Diagnostics tab in the Admin Console.
There are two types of AnzoGraph diagnostic files:
- Xray: Xrays are generated on-demand. If you encounter an error and the database remains running, you generate an Xray to produce the diagnostic files.
- Crash: If you encounter an error that crashes the database, AnzoGraph automatically generates a crash file that contains diagnostic information about the crash.
Xray and crash diagnostics are valuable tools that enable Cambridge Semantics to diagnose and fix issues without access or any other visibility into a customer’s data or database system. They can also be used to report on overall and detailed system performance, resulting in improved query performance for future releases of AnzoGraph.
Xrays and crash dumps harvest the diagnostic data that is stored in AnzoGraph's system tables. They include information such as:
- A low level, de-identified log of the requests that were sent to the database.
- Statistics like query operation step execution times, number of rows processed, and amount of memory used.
- Detailed but de-identified trace information for errors that were encountered.
- Configuration information such as the number of nodes in the cluster and AnzoGraph system settings values.
Xrays and crash dumps are designed to be anonymous and can be safely shared with Cambridge Semantics Support. They do NOT capture user information or any of the data that is loaded into memory by a user, nor do they expose details that could be used to reveal the nature of the data being queried.
Retrieving Xray or Crash Dump Files
Follow the instructions below to download an xray or crash dump to send to Cambridge Semantics Support.
- Log in to Admin Console and click the Diagnostics tab. The console displays the available options. For example:
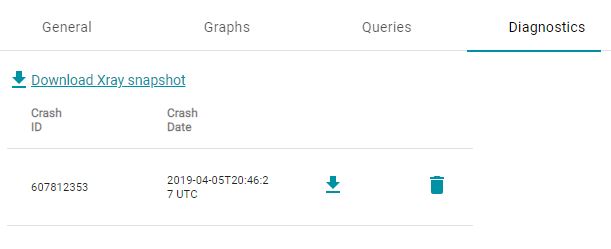
- If you want to retrieve an xray, click the Download Xray snapshot link. AnzoGraph creates the xray and produces a tarball with a .xray extension. The console downloads the .xray file to your computer.
Note: The files in the tarball are compressed. Do not compress the .xray file before sending it to Cambridge Semantics.
- If you want to retrieve a crash dump, click the Refresh button to refresh the list of available crash dump .xray files. Click the file name that you want to download. The console downloads the .xray file to your computer.
Note: The files in the tarball are compressed. Do not compress the .xray file before sending it to Cambridge Semantics.