Quickstart with the Query Console
After deploying AnzoGraph DB, you can get a quick start to loading data and running SPARQL queries by using the GUI-based Query & Admin Console. This brief tutorial introduces you to the application and gets you started with loading data and running SPARQL queries.
Log in to the Console
The AnzoGraph DB console supports the latest Safari, Google Chrome, Mozilla Firefox, and Microsoft Edge browsers.
- Depending on whether you deployed AnzoGraph DB using the RHEL/Rocky installer, Docker, or Kubernetes with Helm, follow the appropriate instructions below to access the user interface:
Deployment Instructions Desktop Container Engine You can use the desktop application to open the AnzoGraph DB container in a browser, or open a browser and go to the following URL: http://127.0.0.1.If you specified a port other than 80 for the host HTTP port when you deployed AnzoGraph DB, include that port in the URL. For example,
http://127.0.0.1:8888.Linux Container Engine If you are accessing a container image on a remote Linux host, note the IP address of the host, and then open a browser and go to the following URL: https://<host_IP_address>.If you mapped the container's HTTPS (8443) port to port 443 on the host when you deployed AnzoGraph DB, you do not need to specify a port. If you specified a port other than 443, include the port in the URL. For example,
https://10.100.0.1:8888.If you are using Docker locally on a Linux machine and need to know the IP address of the AnzoGraph DB container, you can run the following command:
sudo docker inspect <container_name> | grep '"IPAddress"' | head -n 1For example:
sudo docker inspect anzograph | grep '"IPAddress"' | head -n 1
"IPAddress": "172.17.0.2"
Kubernetes with Helm Using the AnzoGraph DB cluster or external IP obtained from the kubectl get servicecommand, open a browser and go to the following URL:https://<IP_address>.EL9 Installer Use the following URL to access the console: https://<host_IP_address>:<https_port>.If you use the HTTPS endpoint, your browser may warn you that the connection is not private. The warning is normal behavior. AnzoGraph DB servers use self-signed certificates, and browsers automatically trust only the certificates from well-known certificate authorities. For more information about certificate warnings, see Security Certificate Errors on the DigiCert website. Depending on your browser, follow the appropriate instructions below to either bypass the warning and continue to the console or configure the browser to trust the certificate:
- On Chrome, click the Advanced link at the bottom of the page and then click the Proceed to ip (unsafe) link.
- On Safari, click the Show Details button and then click Visit Website to import the certificate.
- On Firefox, click Advanced and then click Add Exception. On the next screen, click Add Security Exception to confirm the exception for the endpoint.
The browser displays the login screen.
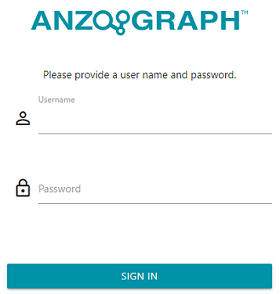
- On the login screen, type the username and password for the Admin user that was set up during deployment. If you deployed AnzoGraph DB with Docker, use admin as the user name and Passw0rd1 as the password.
- Then click Sign In.
The browser displays the AnzoGraph DB End User License Agreement (EULA).
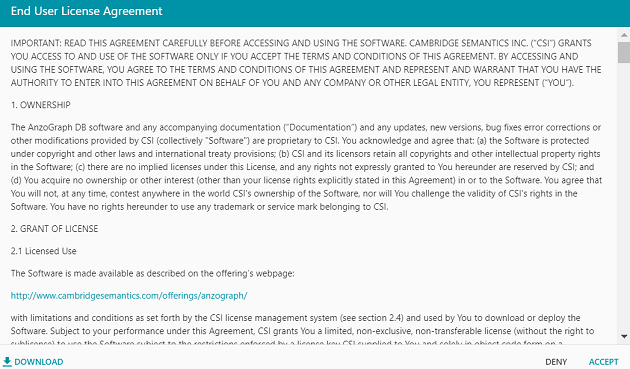
- Review the agreement, and then click Accept to agree to the EULA terms and proceed to the Query & Admin Console.
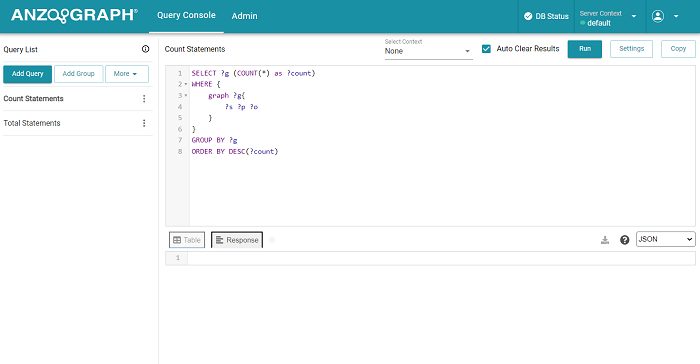
The left-side navigation pane of the Query Console shows two default queries, Count Statements and Total Statements. The Count Statements query returns a list of each named graph and the number of statements in the graph. The Total Statements query returns the total number of statements in all named graphs. Click a query in the navigation pane to open the query in the main window. You can edit or overwrite the default queries, or you can click Add Query to create a new query from scratch. To run a query, click the Run button (
 ) at the top of the screen. The results are displayed at the bottom of the screen.
Load and Query Sample Data
- In the Query Console, click Add Query to add a new, blank query (or you can overwrite one of the default queries). Copy the following query and then paste it into the query text box. This query loads the sample Tickit data from the tickit.ttl.gz directory on the AnzoGraph DB file system. This simple data set captures sales activity for a fictional Tickit website where people buy and sell tickets for sporting events, shows, and concerts.
LOAD <dir:/<install_path>/etc/tickit.ttl.gz>
INTO GRAPH <http://anzograph.com/tickit>
- Once you have pasted the query, replace the placeholder
<install_path>with the path to the AnzoGraph DB installation directory. With Kubernetes or Docker container deployments, the installation path is/opt/anzograph:LOAD <dir:/opt/anzograph/etc/tickit.ttl.gz> INTO GRAPH <http://anzograph.com/tickit>
For RHEL/Rocky deployments, the installation path is specified during the installation. The default path is
/opt/cambridgesemantics/anzograph:LOAD <dir:/opt/cambridgesemantics/anzograph/etc/tickit.ttl.gz> INTO GRAPH <http://anzograph.com/tickit>
Modify the path as needed if an alternate path was chosen.
- Click the Run button to run the query and load the data. When the load completes, the console displays an Update Successful message.
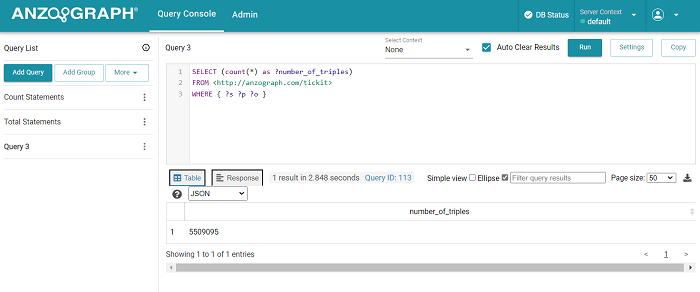
- In the console, replace the load statement with the following simple query that counts the number of triples in the Tickit data
set. Then click Run to run the query:
SELECT (count(*) as ?number_of_triples)
FROM <http://anzograph.com/tickit>
WHERE { ?s ?p ?o }
For example:
If you want to continue to work with the Tickit data and run more complex queries or view explanations of the query syntax, see Working with SPARQL and the Tickit Data. For more information about loading data and to review load file requirements and recommendations, see Load RDF Data from Files.