Area Chart
Area charts are useful for emphasizing trends. Area charts are similar to line charts but have the added ability to display stacked data series.
There are five types of area charts:
| Example | Type | Description |
|---|---|---|
|
|
Area | Connects value points on the chart with straight lines and shades the area below the line. |
|
|
Step Area | Connects value points on the chart with short horizontal steps and shades below the line. This chart emphasizes the extent of value change by expanding the data points across the x axis. |
|
|
Area Spline | Connects value points on the chart with curved lines and shades the area below the line. |
|
|
Stacked Area | Connects value points on the chart with straight lines and shades the area below the line. Add a Series Group to define the groups within the totals. Hover the mouse pointer over a colored area to view the value. |
|
|
100% Stacked Area | Compares each value as a percentage of the total and shades the area below each series. Add a Series Group to define the groups presented as a percentage within the total. |
Area Chart Configuration
In addition to the General Chart Configuration options, the Area Chart Designer includes the following area-chart-specific settings on the Plot tab:
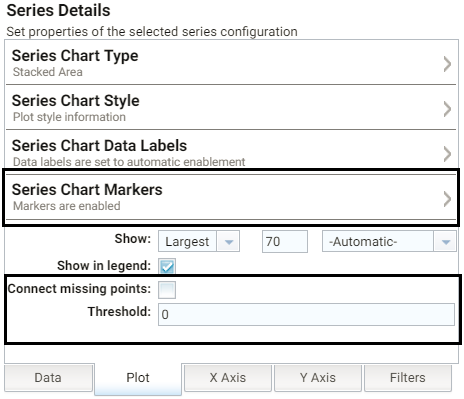
- Series Chart Markers: The options in this category enable you to customize the data points that appear on the series line:
- Enabled: Enables or disables series chart markers.
- Symbol: Selects a symbol to mark data points.
- Marker Radius: Defines the marker size in pixels.
- Fill Color: Defines the marker color.
- Outline Thickness: Defines the thickness of the marker outline.
- Outline Color: Defines the color of the marker outline.
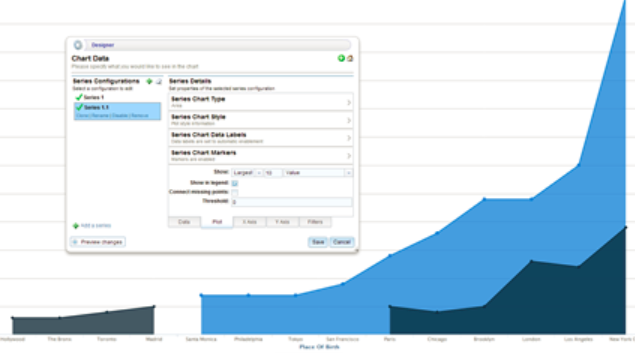
- Connect missing points: Selecting this option connects the graph line across missing points.
For example, selecting Connect missing points for the example below would connect the two dark blue areas by filling in the space between them.
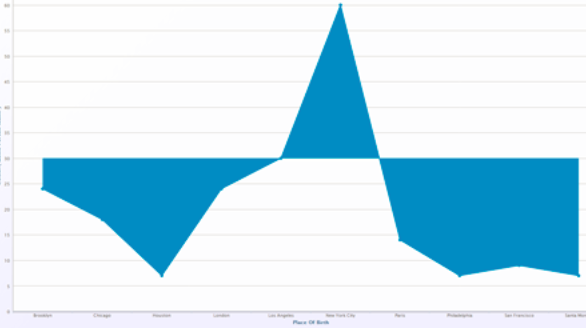
- Threshold: Defines the Y axis value to use as a base (starting point) for the shaded area. For example, a Threshold of 0 begins all shading at the value 0. A Threshold of 10 begins the shading at 10 and draws the area chart above or below the threshold as required. For example, the image below shows an area chart with a threshold of 30.