Bubble Chart
Bubble charts are useful for displaying data that has a third dimension. Bubble charts plot points for the X axis, Y axis, and represent relative size.
![]()
Bubble Chart Configuration
In addition to the General Chart Configuration options, the Bubble Chart Designer includes the following bubble-chart-specific settings on the Data tab:
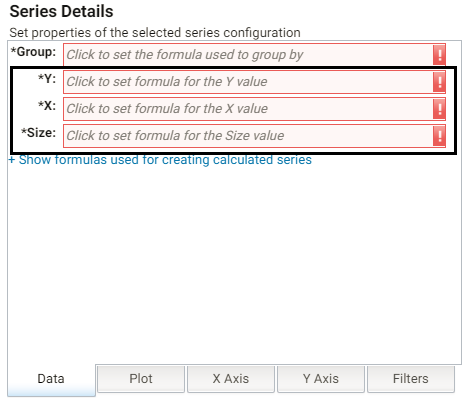
- Y: Selects the Y axis values.
- X: Selects the X axis values.
- Size: Selects the property to use to determine the proportionate bubble size.
The Bubble Chart Designer also includes the following bubble-chart-specific settings on the Plot tab:
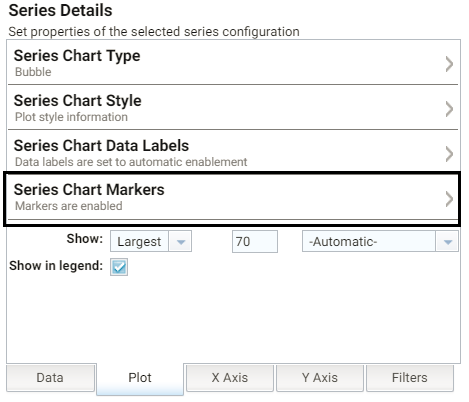
Series Chart Markers: The options in this category enable you to customize the data points, such as outlines, that appear on the bubbles:
- Enabled: Enables or disables series chart markers.
- Symbol: Selects a symbol to mark data points.
- Marker Radius: Defines the marker size in pixels.
- Fill Color: Defines the marker color.
- Outline Thickness: Defines the thickness of the marker outline.
- Outline Color: Defines the color of the marker outline.
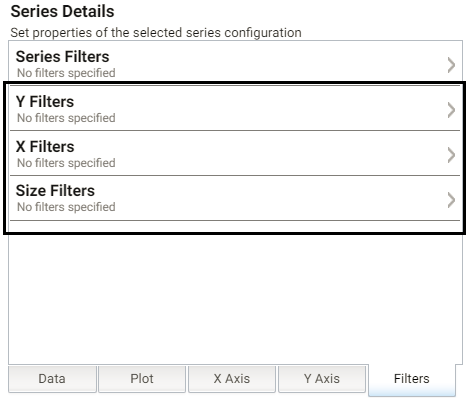
The Bubble Chart Designer enables you to create filters for the X, Y, and Z (Size) axes from the Filters tab.