Line Chart
There are three types of line charts:
| Example | Type | Description |
|---|---|---|
|
|
Line | Connects value points with straight lines. |
|
|
Spline | Connects value points with curved lines. |
|
|
Step Line | Connects value points with short horizontal steps. This chart emphasizes the extent of value change by expanding the data points across the X axis. |
Line Chart Configuration
In addition to the General Chart Configuration options, the Line Chart Designer includes the following line-chart-specific settings on the Plot tab:
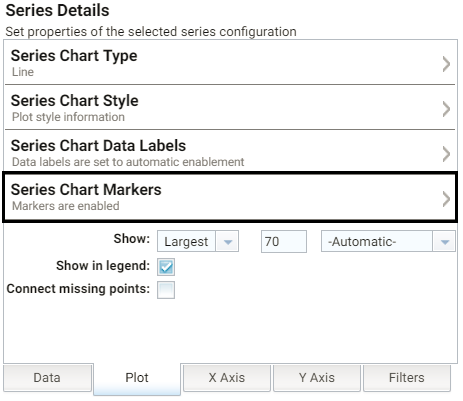
Series Chart Markers: The options in this category enable you to customize the data points on the lines:
- Enabled: Enables or disables series chart markers.
- Symbol: Selects a symbol to mark data points.
- Marker Radius: Defines the marker size in pixels.
- Fill Color: Defines the marker color.
- Outline Thickness: Defines the thickness of the marker outline.
- Outline Color: Defines the color of the marker outline.