Generating Data Quality Metrics for a Data Source
To help users assess the quality of the data coming from a data source, Anzo provides the ability to calculate metrics for each source. When metrics are generated, Anzo profiles the entire data set and reports the following details:
- Column Presence: The number of populated, null, or empty rows for each column.
- Column Row Type: The number of rows for each column grouped by data type.
- Column Value Counts: The number of rows for each column grouped by value.
In addition to the profiles above, Anzo also produces foreign key suggestions that you can click to activate.
Note: For additional metrics based on the type of data quality checks needed, contact Cambridge Semantics.
Generating Metrics
Follow the steps below to generate and review data quality metrics for a data source.
- In the Anzo console, expand the Onboard menu and click Structured Data. Anzo displays the Data Sources screen.
- Click the Schemas tab to view the existing schemas. For example:
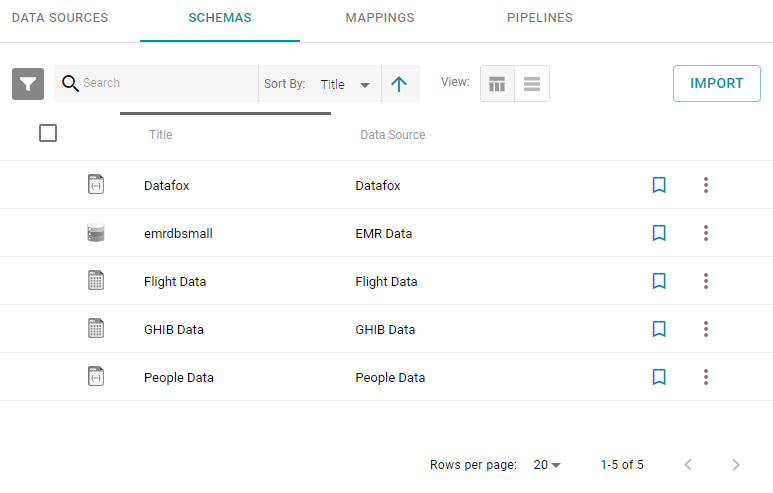
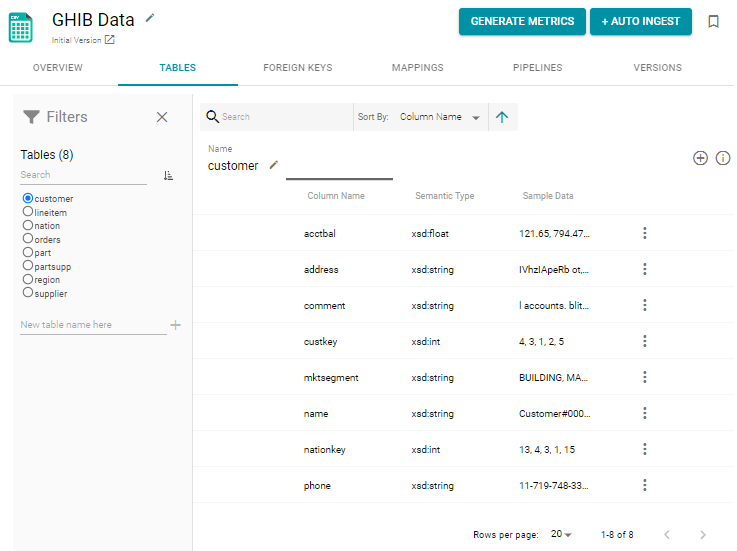
- On the Schemas screen, click the name of the schema for which you want to generate metrics. Anzo displays the schema Tables screen. For example:
You can click the Overview tab for the schema to view the information that exists prior to generating metrics. For example, in the image below the Row Count is N/A for all tables:
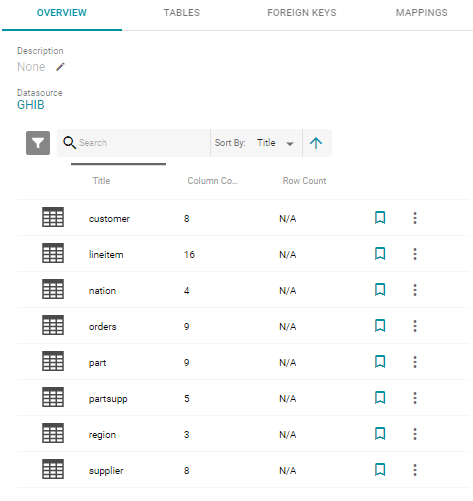
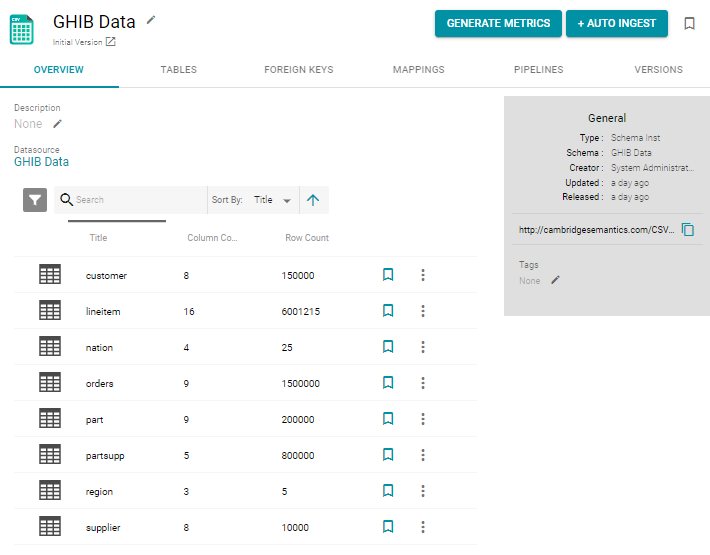
Generating metrics populates the Row Count column and provides additional details.
- Click the Generate Metrics button to generate metrics. Anzo displays a warning that the process may consume a lot of server resources. Click Yes to continue. Anzo calculates metrics for each table and displays the progress at the top of the screen. For example:

When Anzo finishes generating metrics, the row counts are populated on the Overview screen. For example:
- To view the column presence, row type, and value counts, click a table name on the Overview screen. Anzo displays the details for that table. For example:
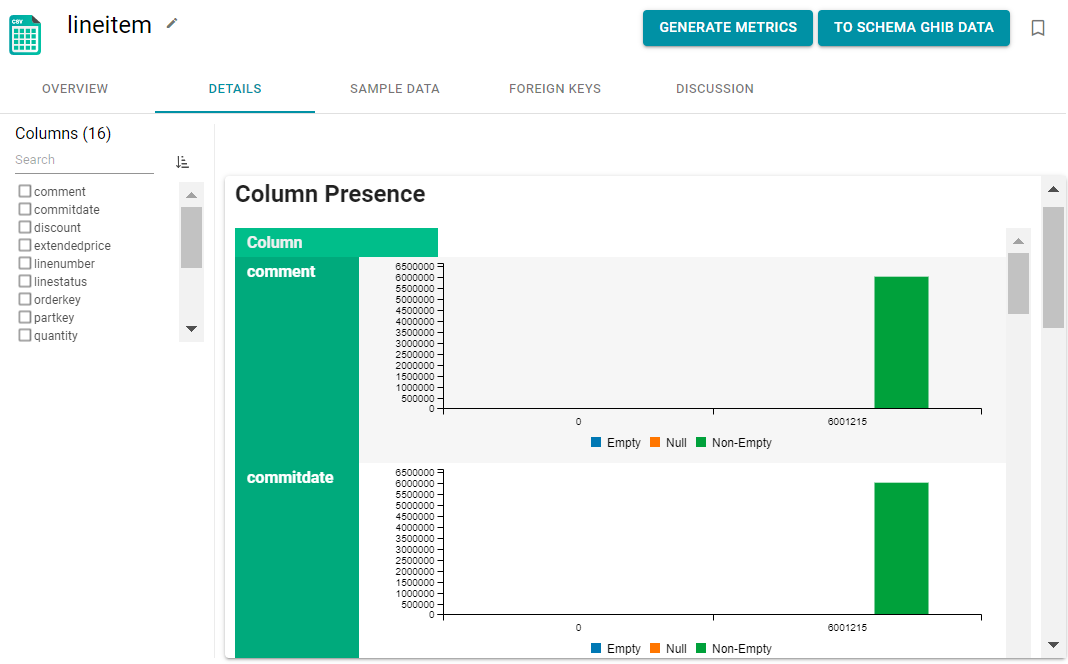
By default, Anzo shows the metrics for all columns in the table. To narrow the results and filter by column, select the checkboxes next to the column names on the left side of the screen.
- If you want to review a sample of the values for the columns in the table, you can click the Sample Data tab.
To return to the schema Overview screen and view the metrics for a different table, click the To Schema Name button at the top of the screen. Then click the Overview tab and select a table name from the table.