Creating a Lens
Lenses define the data’s visual presentation. Each type of lens represents a unique method for displaying data. For instance, in a column chart, you can present multiple data series for comparison. You can also apply custom formats such as fonts and colors to any lens. This topic provides instructions for creating and cloning lenses.
Creating a New Lens
- Open the dashboard that you want to add a lens to.
- In the Hi-Res Analytics main toolbar, click Lenses and select New. The Create Lens window opens.
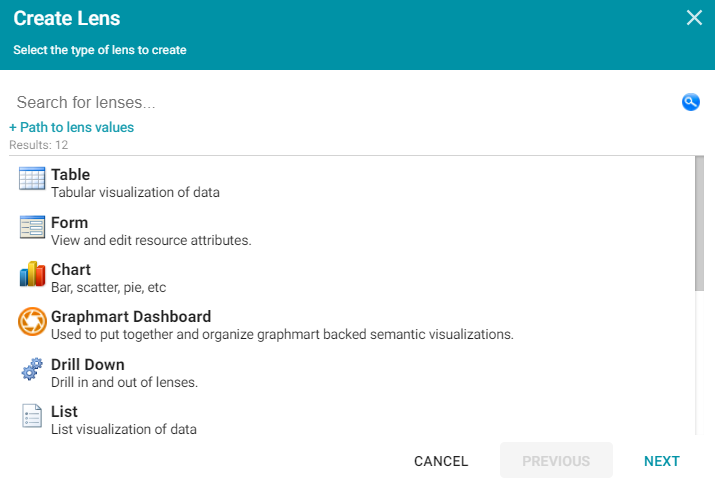
- Determine the type of lens that you want to create. The following list describes each lens type. For more information about each lens type, see Lens Type Reference.
- AnzoKO Web Page: Includes the Knockout JavaScript framework and displays data on a web page that you create using HTML, CSS, and JavaScript.
- Chart: Displays results in rectangular columns, 3D bubbles, scatter charts, heat maps, or other chart types. A chart lens has the widest format range of any lens type. These lenses are useful for displaying large amounts of complex data. The ability to add an axis enables you to compare data, such as comparing monthly sales data for multiple stores.
- Dashboard: Dashboard lenses display a dashboard within a dashboard.
- Drill Down: Creates clickable data points that enable you to drill down to view additional details. You can specify multiple lenses within the Drill Down lens so that clicking a data point presents the data in a different view. When you select a Drill Down lens, the Designer opens and prompts you to select the lenses that you want to use for the drill down functionality. The top lens in the Designer becomes the primary lens with the clickable data points. You can drag lenses to re-order them. You then separately configure each of the lenses that you selected. There is no further configuration for the drill down.
- Form: Enables you to create an editable or read-only form on the dashboard. Form lenses can be useful for displaying many details about a record. Form lenses are read-only when used with graphmarts.
- List: Displays results as icons in a folder view, similar to the Microsoft Windows® Explorer interface. List lenses enable you to add images for each data value.
- Query: Retrieve data using a custom SPARQL query and display the results by writing basic HTML and CSS. You can use a Query lens to access data from external sources. Query lenses do not bind directly to the data set, data type, or filters defined on the dashboard.
- Resource Tree Navigator: Displays results in a hierarchical tree view. Click parent data points to open the successive child data points. You can also click certain objects to view the object's data properties in the left panel. This lens is useful for presenting small amounts of hierarchical data.
- Table: Presents results in a basic table grid consisting of rows and columns. Table lenses are useful for presenting data aggregates or summaries.
- Web Page: Displays results on a custom web page that you create using HTML, CSS, and JavaScript.
- On the Create Lens dialog box, select the type of lens that you want to add to the dashboard, and then click Next. Anzo displays the General Information dialog box.
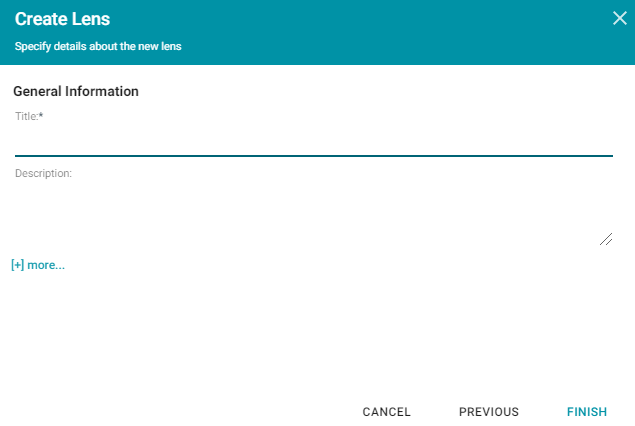
- Type a Title and optional Description for the lens.
- Click Finish. The lens Designer dialog box opens to enable you to configure the lens.
- Configure the lens and then click Save to save the configuration and add the lens to the dashboard. For information about using formulas to compute the values to display in the lens, see Calculating Values in Lenses and Filters.
Cloning a Lens
Cloning a lens makes a copy of the lens that can be changed without affecting the original lens or other dashboards.
You can only clone lenses from dashboards that you have permission to modify. If you open a dashboard with read-only access, the Open Lens and Clone options are not available. To clone a lens from a read-only dashboard, save a copy of the dashboard so that you become the owner. To save a copy, click the Dashboard button in the main Hi-Res Analytics toolbar and select Save As. Then follow the procedure below to clone a lens into the dashboard that you own.
- Open a dashboard in the Hi-Res Analytics application, then click Lenses in the main toolbar and select Open. Anzo opens the Lens Selection dialog box, which lists the lenses that are available to open. For example:
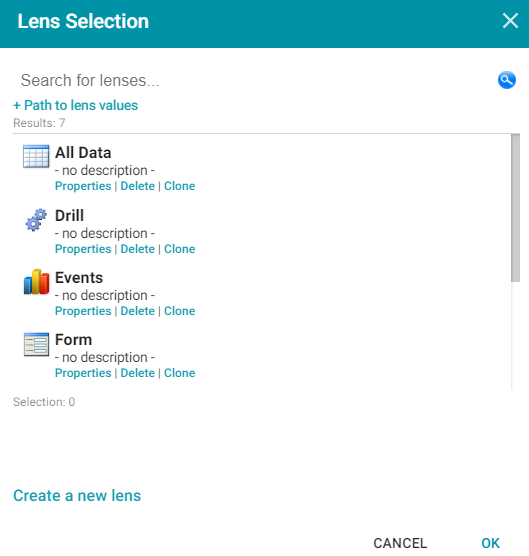
- Click the Clone link for the lens that you want to clone. Anzo displays the Clone lens dialog box, and populates the Title field with the existing lens name and "(clone)." For example:
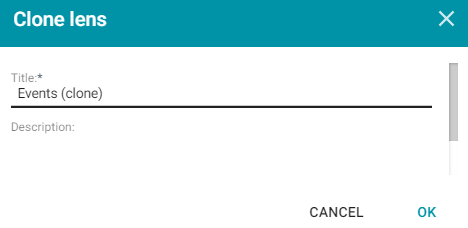
- Modify the Title to name the new copy of the lens, and add or change the Description if necessary. Then click OK.
- Anzo adds the new copy of the lens to the Lens Selection dialog box and selects it. Click OK to add the lens to the dashboard.