Creating a Custom Endpoint (Preview)
Follow the instructions below to create a Custom Data on Demand endpoint (sometimes called a Table endpoint). Creating a Custom endpoint is similar to creating a Hi-Res Analytics Table lens. You build a table with the columns that you want to see. You can traverse the relationships and join classes, add filters, and apply functions to properties. The tables are translated to SPARQL queries that create views in AnzoGraph, allowing you to interact with the graph for complex analytics but generate results in the tabular format that BI tools expect.
The Custom Data on Demand Endpoint feature is available as a Preview release, which means the implementation has recently been completed but is not yet thoroughly tested and could be unstable. The feature is available for trial usage, but Cambridge Semantics recommends that you do not rely on Preview features in production environments.
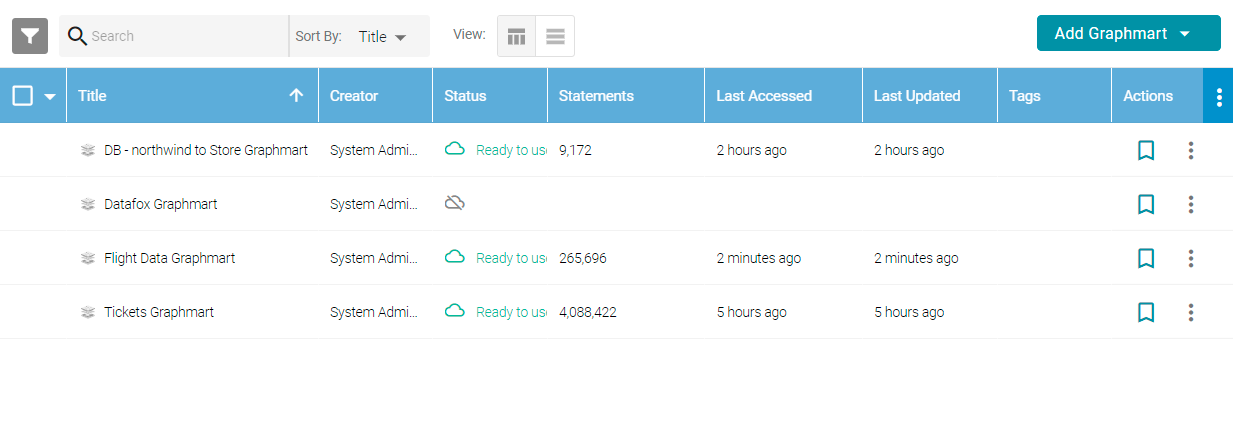
- In the Anzo application, expand the Blend menu and click Graphmarts. Anzo displays a list of the existing Graphmarts. For example:
- On the Graphmarts screen, click the name of the Graphmart for which you want to create an endpoint.
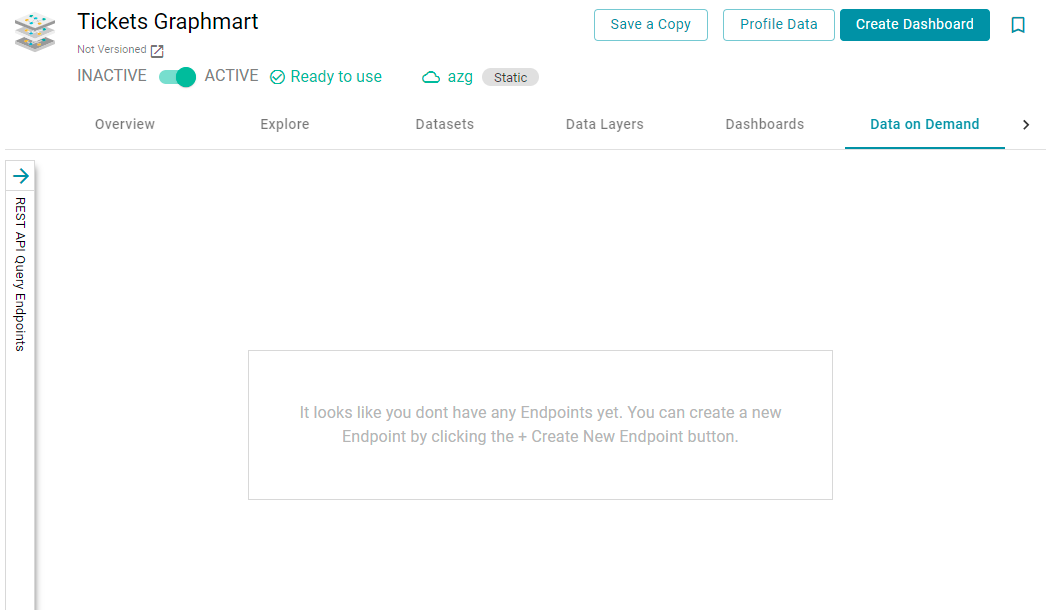
- Click the Data on Demand tab. Anzo displays the Data on Demand screen, which lists any existing endpoints. For example, the image below shows a Graphmart that does not have any endpoints configured:
- If necessary, expand the REST API Query Endpoints panel on the left side of the screen, and then click the Create New Endpoint button. Anzo displays the Create REST API Query Endpoint screen.
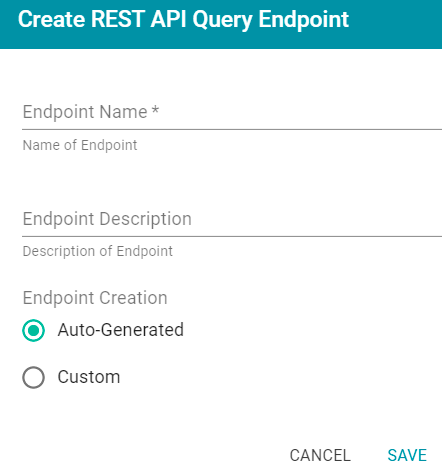
- Type a name for the endpoint in the Endpoint Name field. The endpoint name must be unique. In addition, add an optional description in the Endpoint Description field.
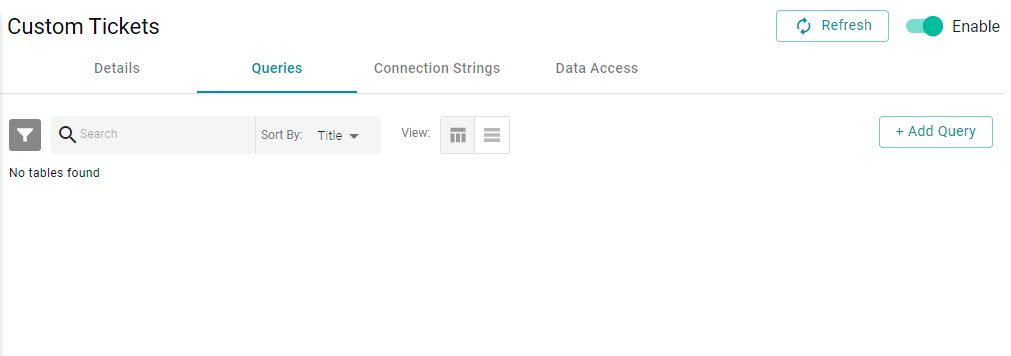
- By default, the Endpoint Creation type is set to Auto-Generated. Select the Custom radio button and then click Save. The endpoint is created and is empty until you create queries. For example, the image below shows a new empty endpoint:
- To start building a table, click the Add Query button. The New Query dialog box is displayed.
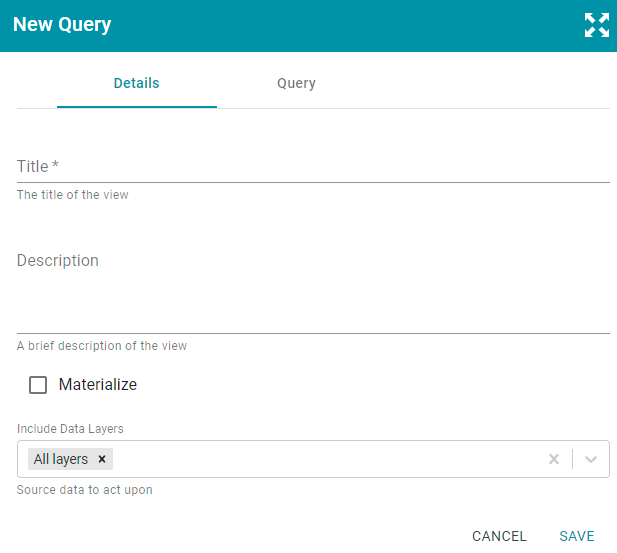
- On the Details tab, configure the following details:
- Type a name for the table in the Title field. The table name must be unique. In addition, add an optional description in the Description field.
- If you want to store a copy of the data that this table creates (materialize the data), select the Materialize check box. When this option is disabled AnzoGraph creates a virtual view where only the view definition is stored in memory and not a copy of the data. If a request is made against this view, AnzoGraph temporarily materializes the data in memory, performs the query operations, and drops the temporary data.
- By default, the Include Data Layers option is set to include All Layers. If you do not want the query to target the source data in all layers, select the field and choose alternate layers from the drop-down list.
- Click the Query tab to start building the table, which Anzo converts to a SPARQL query.
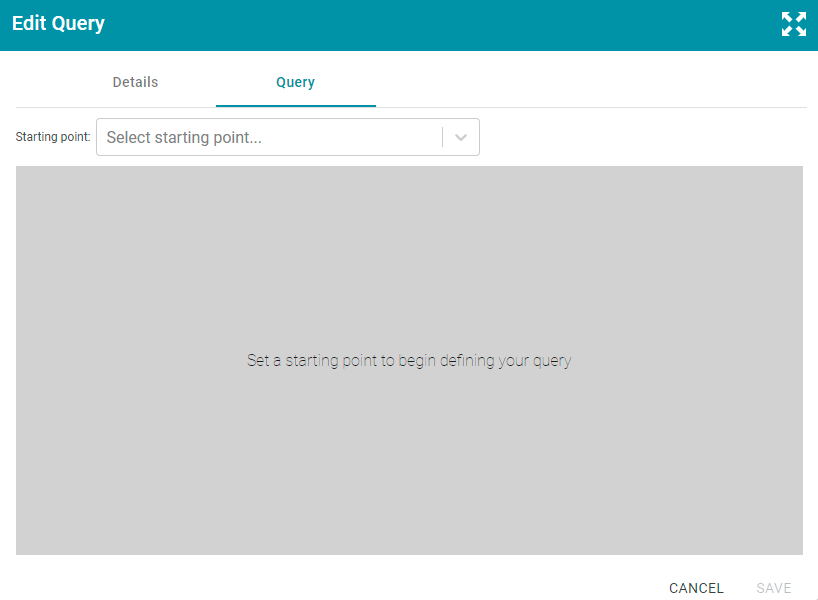
- On the Query screen, get started by selecting the Class to use as the starting point. Click the Starting Point drop-down list and select a Class. Once you select the class, the Add Column button is displayed.
- Click Add Column to create a column in the table. The Edit Column dialog box is displayed:
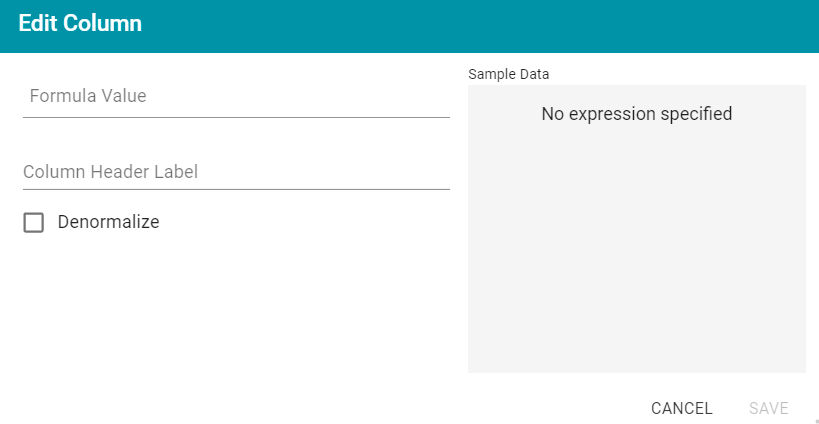
- On the Edit Column screen, configure the following options:
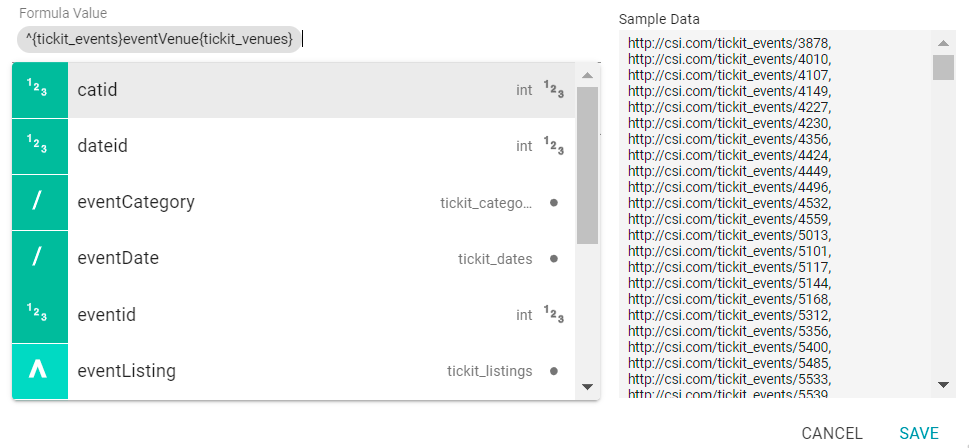
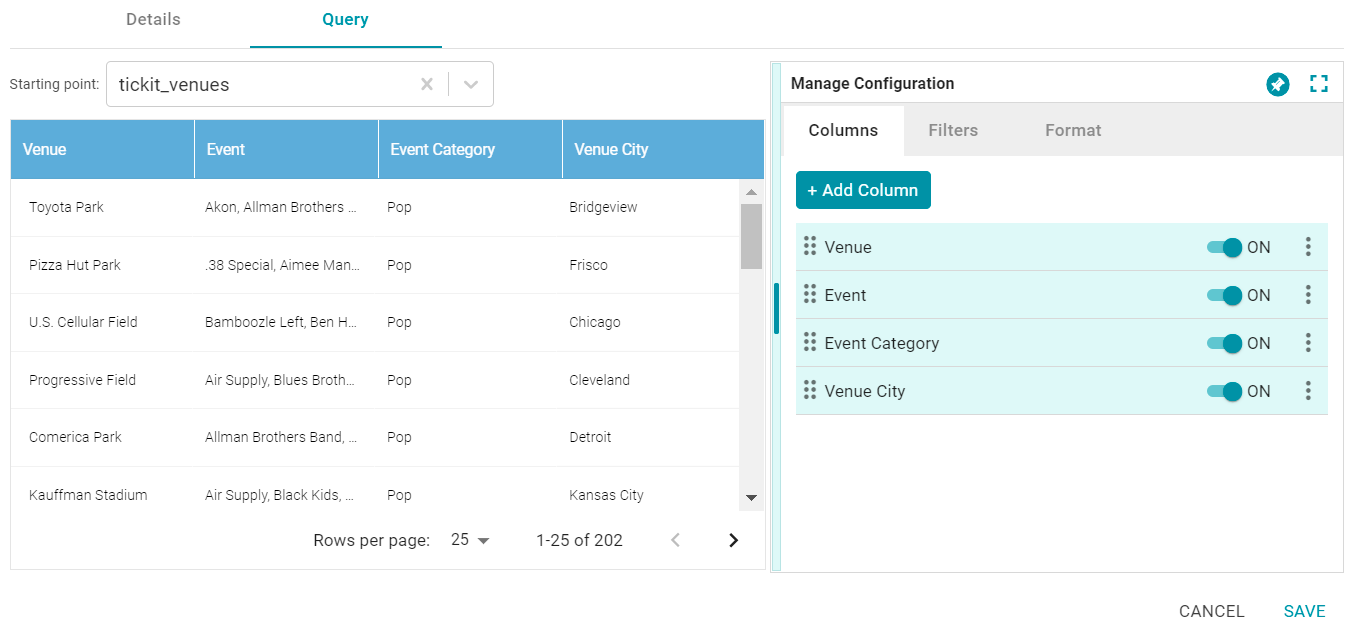
- Formula Value: Click this field to choose the column header. Like building columns in dashboard Table lenses, you can navigate the relationships to join data from different classes, and you can apply functions to the values. When you click the field and start to select paths and properties, sample data is shown on the right side of the screen. For example:
- Column Header Label: This is the label that you want to use for displaying the Formula Value.
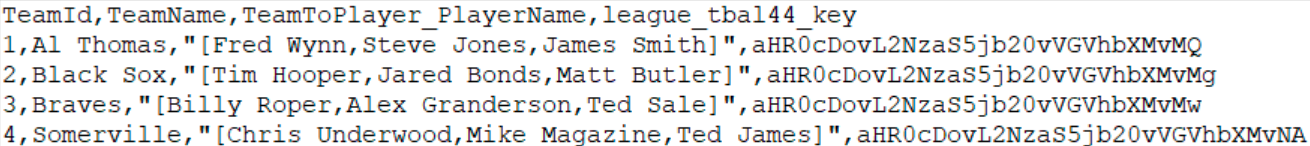
- Denormalize: This setting controls how multi-valued properties are formatted in exported output. When Denormalize is disabled (the default value) multi-value properties are output in arrays. When Denormalize is enabled, each value gets its own row. For example, the following image shows the output of multi-value properties when Denormalize is disabled:
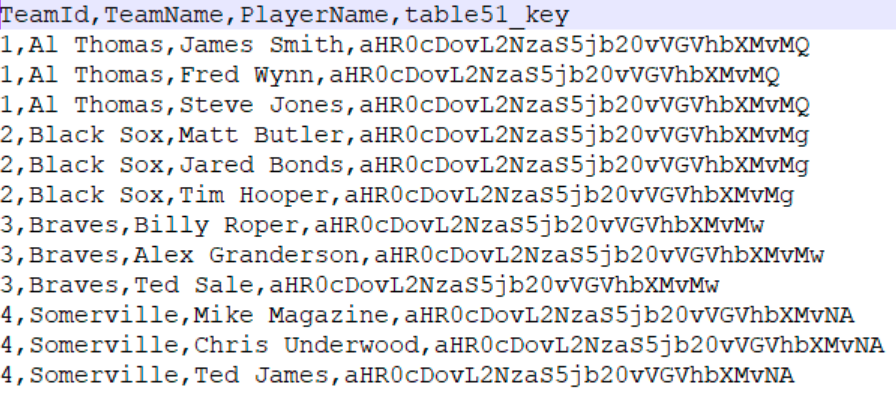
And the example below shows the output of multi-value properties when Denormalize is enabled:
If you do not Denormalize the data, you can use the Format tab to specify the character to use for separating values in the arrays that are returned for multi-value properties. By default, the Value Separator is set to comma (,).
- Formula Value: Click this field to choose the column header. Like building columns in dashboard Table lenses, you can navigate the relationships to join data from different classes, and you can apply functions to the values. When you click the field and start to select paths and properties, sample data is shown on the right side of the screen. For example:
- Add new columns to the table by clicking Add Column on the right side of the screen. You can change the order of columns by dragging a column up or down, and you can enable or disable columns by sliding the slider for the column. Click the menu icon for a column to edit or delete that column.
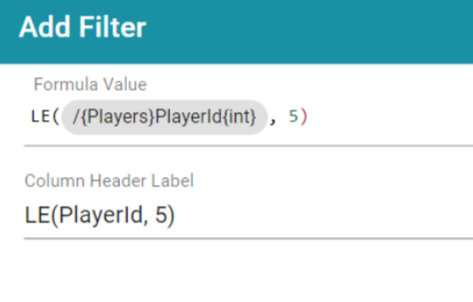
- If you would like to filter out some data, you can add one or more filters to the overall query. To add a filter, click the Filters tab and then click Add Filter. In the Formula Value field, specify the formula to use to determine which values should be included in the results. Then specify a name for the column in the Column Header Label. For example, the filter below is configured to include only the results where the Player ID is less than or equal to 5.
Once you are satisfied with the configuration, this Data on Demand endpoint is ready for access via OData/ODBC or JDBC. On the Connection Strings tab for the endpoint, retrieve the ODBC or JDBC service URL to use to access the endpoint. For example:
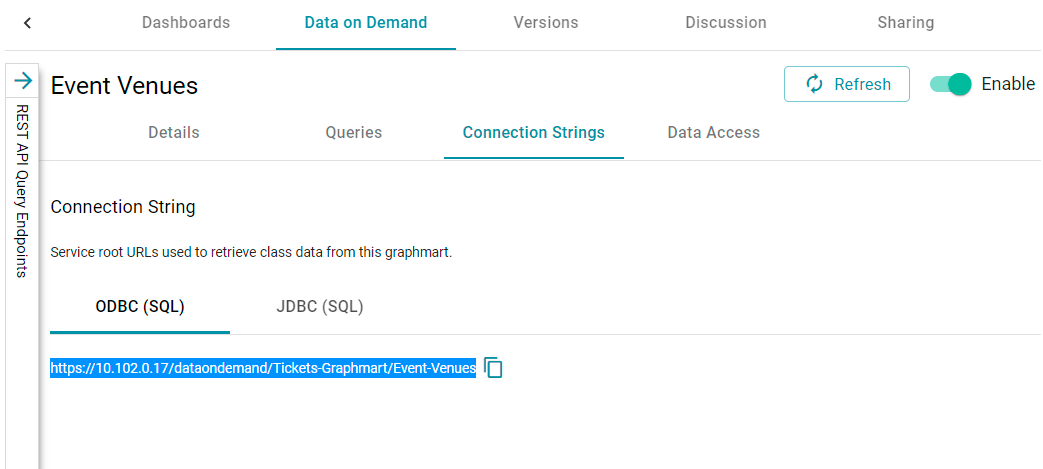
To test whether the endpoint is active, you can copy the ODBC service URL and paste it into a web browser.
After pasting the URL into the browser, add the table name to the end of the string. The URL for a Custom endpoint is <ODBC_or_JDBC_URL>/<table_name>. For example, if the ODBC URL is https://10.10.0.10/dataondemand/Tickets-Graphmart/Event-Venues, and the table name is Venues, the connection string is https://10.10.0.10/dataondemand/Tickets-Graphmart/Event-Venues/Venues.
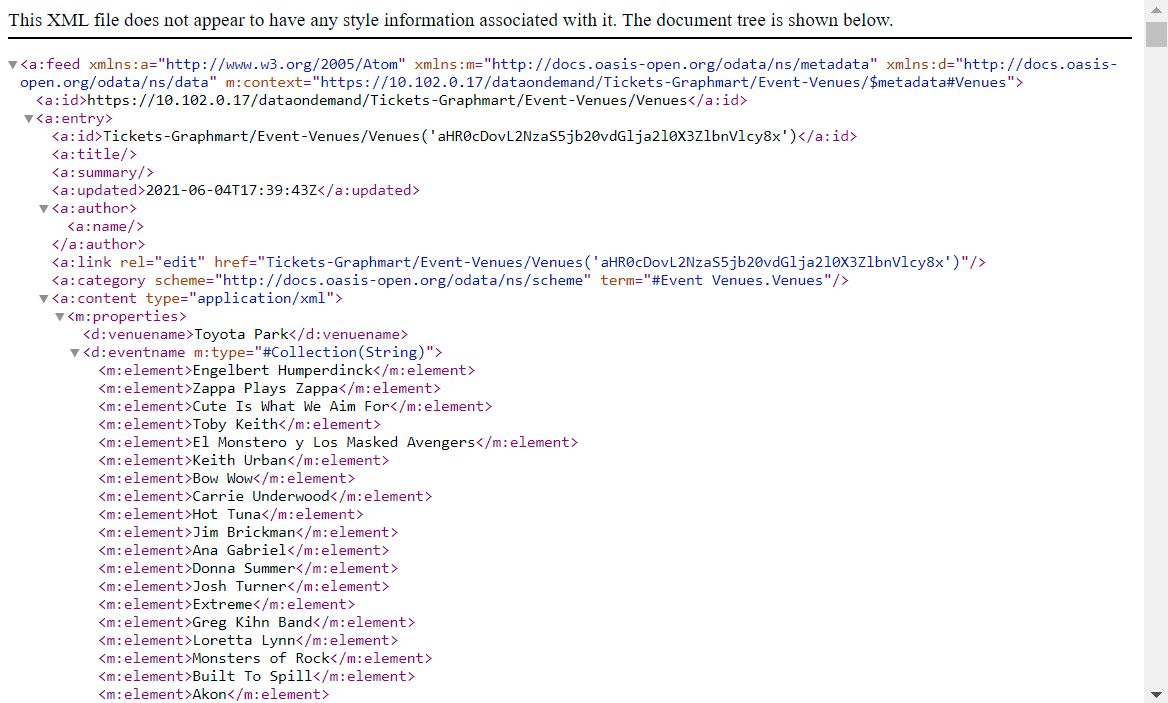
If the endpoint is active, the browser shows an XML feed of the data. For example:
The endpoint is accessible only when it is Enabled and the associated Graphmart is Active.
For information about accessing endpoints programmatically, see Accessing an Endpoint Programmatically. For information about accessing endpoints with third-party analytics tools, see Accessing an Endpoint from an Application. For information about the supported OData operators, output format, and query examples, see OData Reference.