Generating a Dataset Data Profile
Similar to generating a profile for a data source (see Generating a Source Data Profile), Anzo provides the ability to profile a graph data set in its final format. When metrics are generated for graph data, Anzo profiles the entire data set and reports metrics for the classes and properties in the model as well as statistics about the values for the properties. Generating a graph data profile helps users perform data discovery, assess the quality of the onboarded data, and decide whether to use the data set in a particular graphmart. The report can also assist users in determining the types of data layers to create and writing the queries to include in the steps.
To generate a graph data profile, AnzoGraph must be online. If you have dynamic AnzoGraph deployments enabled, Anzo will provision AnzoGraph automatically when metrics are generated.
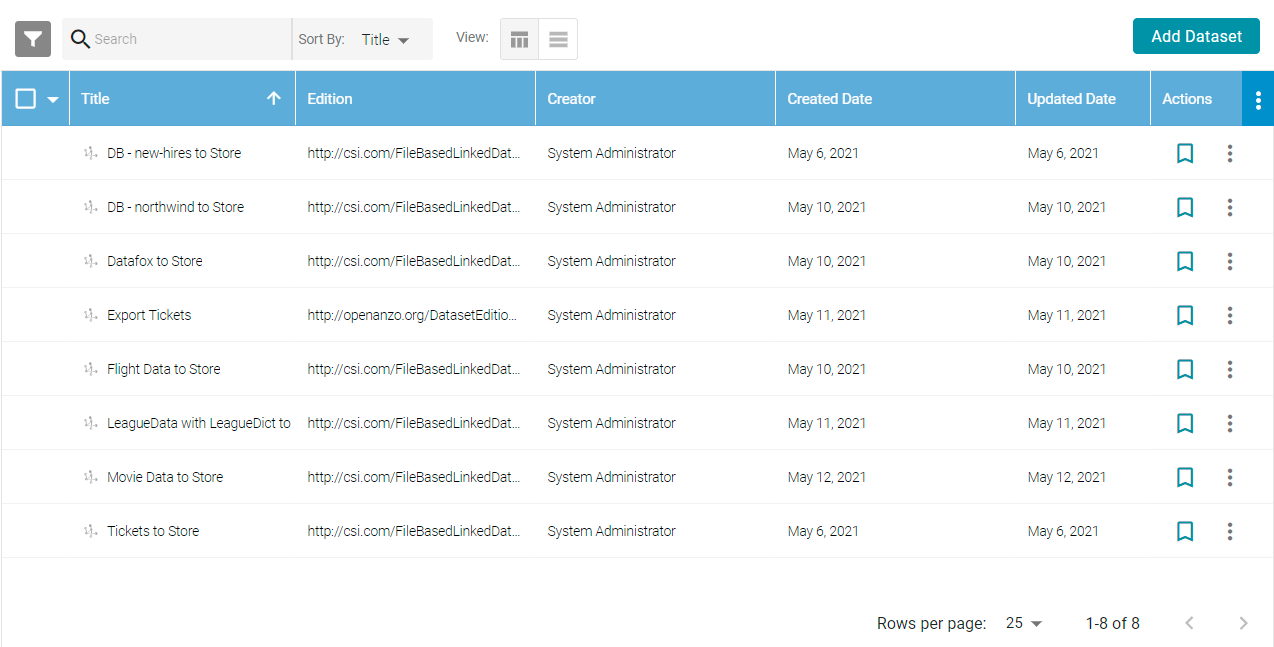
- In the Anzo application, expand the Blend menu and click Datasets. Anzo displays the Datasets screen, which lists the catalog of Datasets. For example:
- On the Datasets screen, click the name of the data set for which you want to generate metrics. Anzo displays the Explore screen for the source. For example:
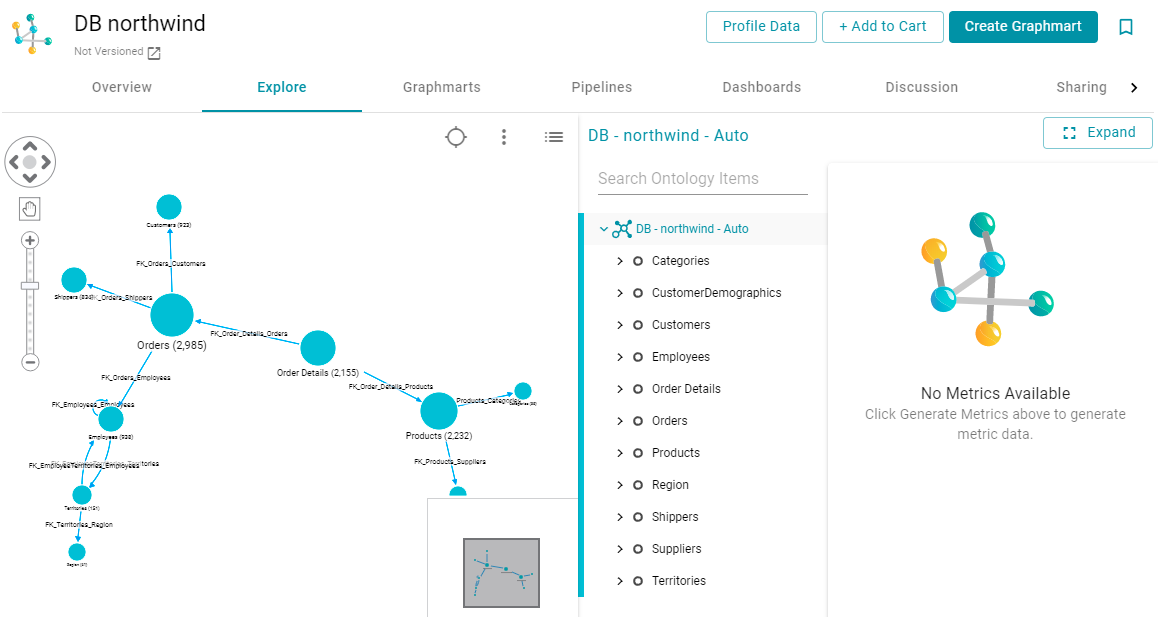
The instance counts for the classes in the graph view on the left side of the screen are the initial, non-unique counts from the ETL engine. Most likely the data has not yet been deduplicated. After generating metrics, the instance counts may change.
- Click the Profile Data button at the top of the screen. Anzo provisions a temporary graphmart and loads the data into AnzoGraph. AnzoGraph computes the data profiling metrics. The process may take several minutes. You can check the status of the process in the Activity Log. The Activity Log also presents the option to stop the profiling process by clicking Cancel under the progress bar for the task. For example:
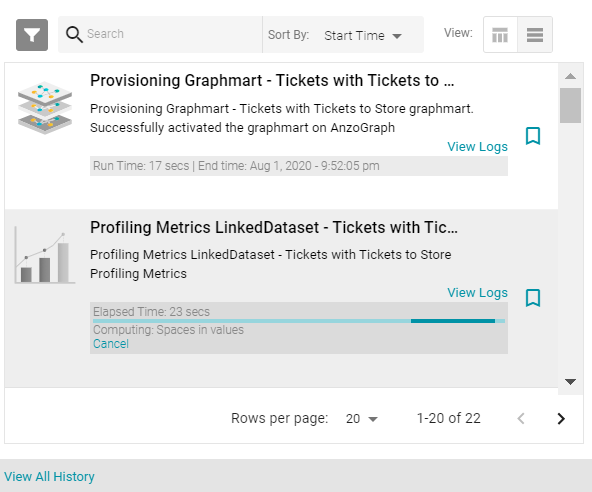
Once the metrics are generated, Anzo removes the graphmart from AnzoGraph and the new information becomes available to explore in Anzo.
Graph data profiles are always generated against the Default Edition of the data set. Saved Editions are not included.
- To display the metrics, select a node or edge in the graph view on the left side of the screen or expand the model in the middle of the screen and select a class or property. For example:
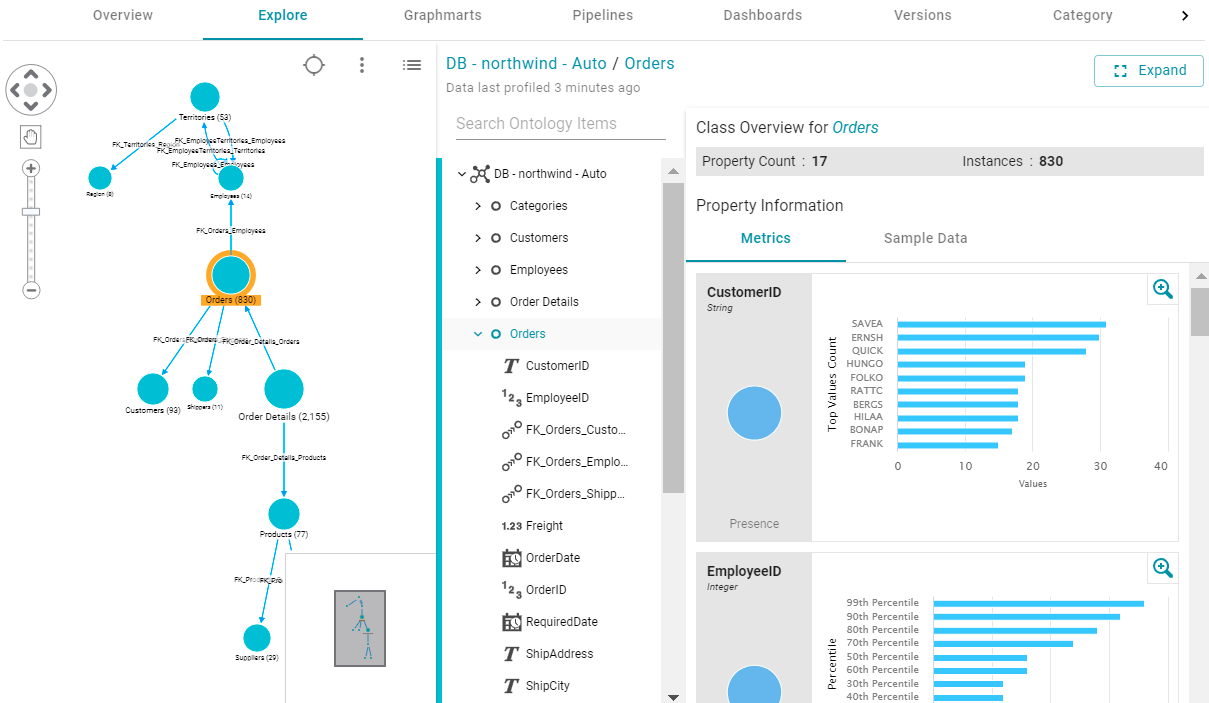
You can click the Expand button on the right side of the screen to collapse the graph view and expand the metrics view. For example:
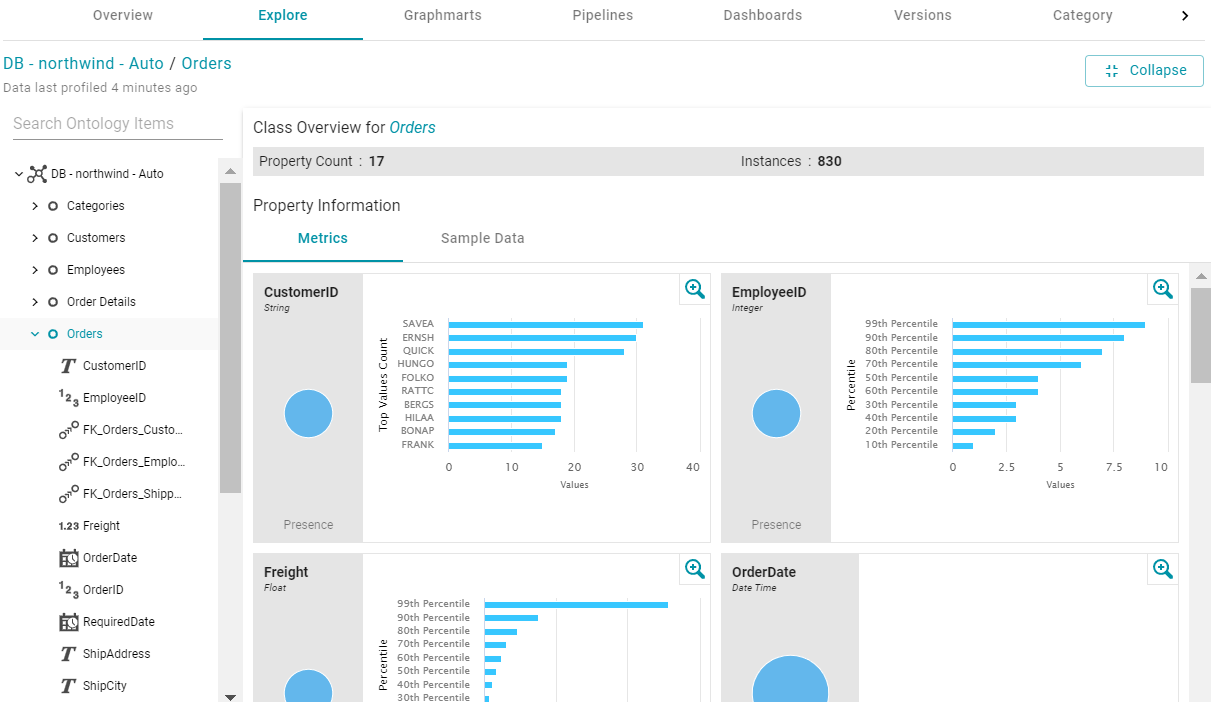
Select any class or property to view its metrics. When a class is selected, Anzo displays the number of properties and total number of instances as well as one or more of the following metrics for each property in the class. The metrics that are calculated depend on the data type of the properties:
- Percentile Metric: This metric presents the data distribution for a property in percentiles.
- Top Value Counts Metric: This metric displays the count (as a histogram) of the 10 most frequently occurring values for a property.
- Presence Metric: This metric displays the number of values present and not present for a property.
When a property is selected, Anzo displays the metrics described above and one or more of the following metrics, depending on the data type of the property:
- Extrema Metric: Shows the smallest and largest values.
- Geometric Mean Metric: Shows the geometric mean of the values.
- Median Metric: Shows the middle value.
- Mode Metric: Shows the value that appears most often.
- Std Deviation Metric: Shows the standard deviation in the set of values.
- Unique Values Metric: Shows the number of unique values.