Generating a Source Data Profile
To help users assess the quality of the data coming from a Data Source, Anzo provides the ability to calculate metrics for each source. When metrics are generated, Anzo profiles the entire source data set and reports statistics for each table in the Schema, such as the number of populated, null, or empty rows for each column in a table and the number of rows for each column grouped by value. It also reports column-level metrics such as the smallest and largest values in a column, the number of unique values, and the value that appears most often. For Schemas with multiple tables, Anzo also generates a list of Foreign Key suggestions between tables that include the same column.
AnzoGraph performs Data Source Profiling. That means AnzoGraph needs to connect directly to any Data Sources that you profile. For file-based data sources, AnzoGraph uses the Graph Data Interface (GDI) Java plugin to access the sources. The plugin is not installed by default and needs to be deployed to AnzoGraph. For instructions, see Deploy the Graph Data Interface Java Plugin.
For database Data Sources, AnzoGraph requires the GDI plugin plus the same drivers that you have configured to access those sources in Anzo. To configure AnzoGraph to profile relational data sources, copy the necessary driver .jar files to AnzoGraph and restart the database. For instructions, see Deploy Optional Drivers for Accessing Database Sources.
Dynamic AnzoGraph deployments are pre-configured with JDBC drivers for the following database types:
- Apache Derby, Hive, and Impala
- Google BigQuery
- IBM DB2
- Microsoft SQL Server
- MariaDB/MySQL
- Hyper SQL Database (HSQLDB)
- PostgreSQL
- SAP Sybase (jTDS)
Follow the instructions below to generate and review data quality metrics for a Data Source.
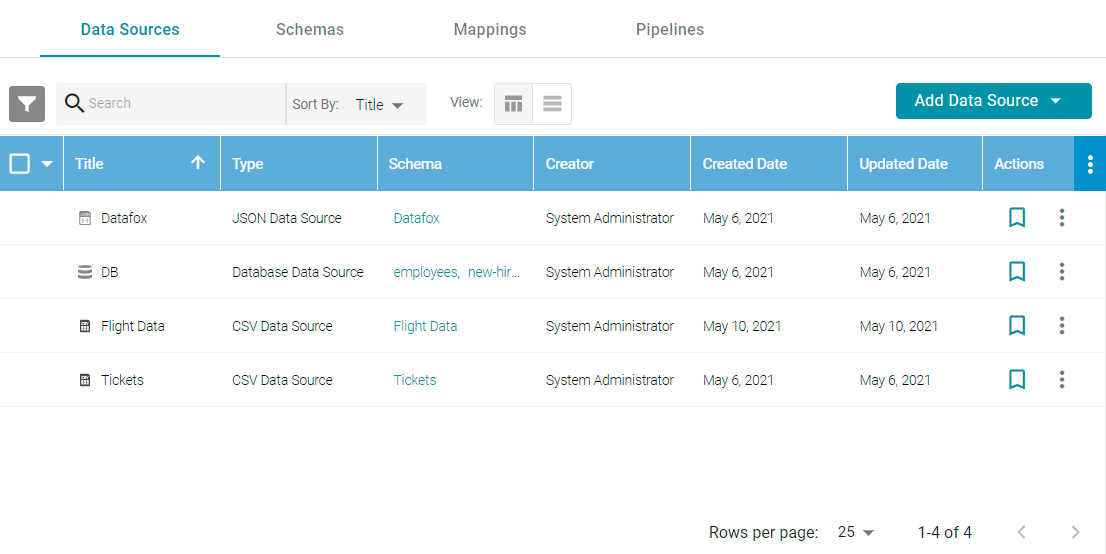
- In the Anzo application, expand the Onboard menu and click Structured Data. Anzo displays the Data Sources screen, which lists any existing Data Sources. For example:
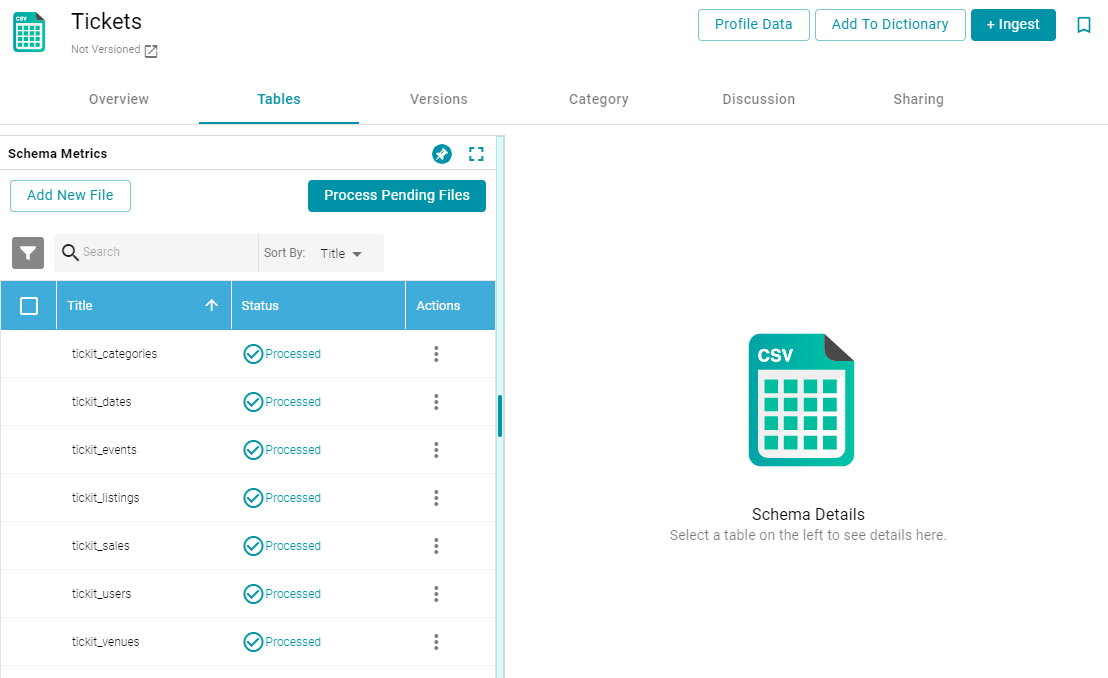
- Click the data source that you want to profile. Anzo displays the Tables tab for the source, which lists the schema and table details. For example:
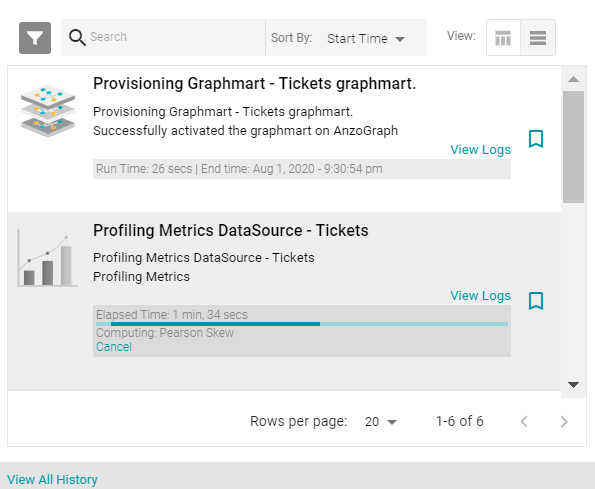
- Click the Profile Data button at the top of the screen. AnzoGraph runs several queries to calculate metrics about the source data. The process may take several minutes. You can check the status of the process in the Activity Log. The Activity Log also presents the option to stop the profiling process by clicking Cancel under the progress bar for the task. For example:
- When the process is complete, select a schema row on the left side of the screen, and then click the Metrics tab next to the Sample Data tab in the middle of the screen. Anzo displays the metrics for the selected table. For example:
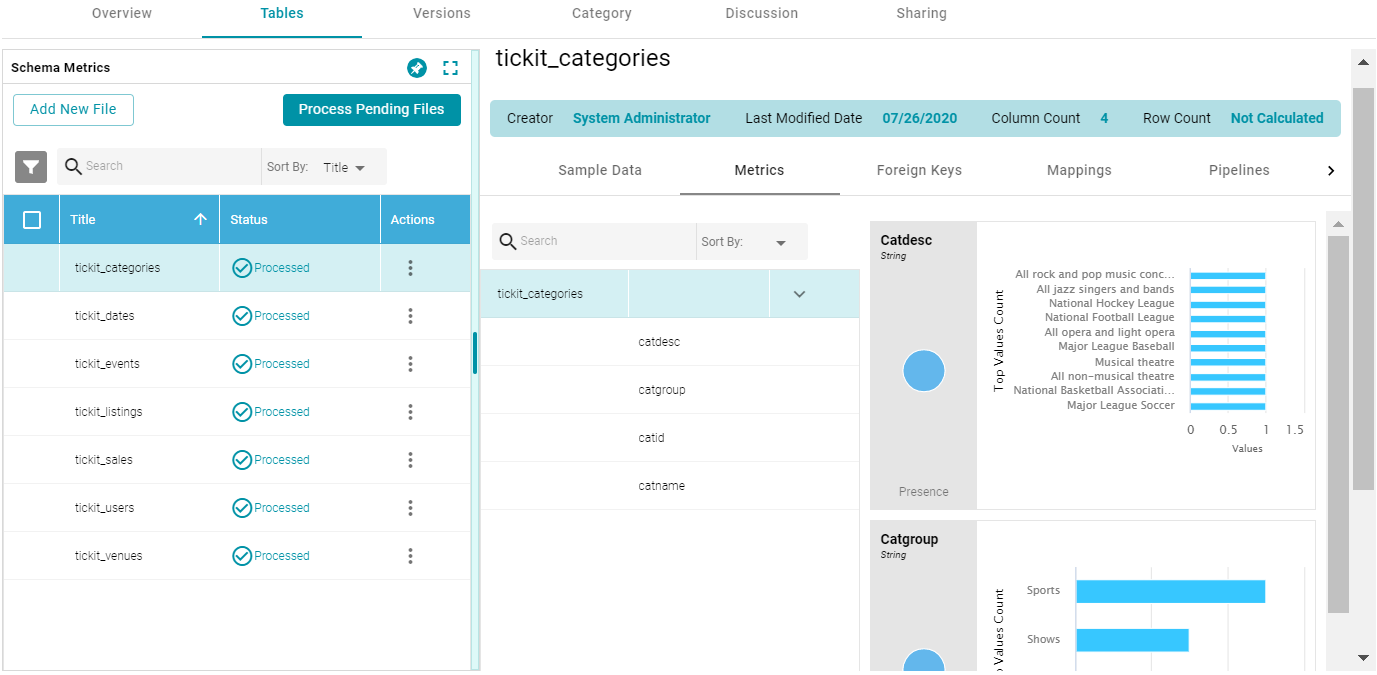
On the far right of the screen, Anzo shows the metrics for each column in the selected table. To select a different table, click another row on the left side of the screen. To view additional metrics for a column in the table, click a column name in the middle of the screen. For example:
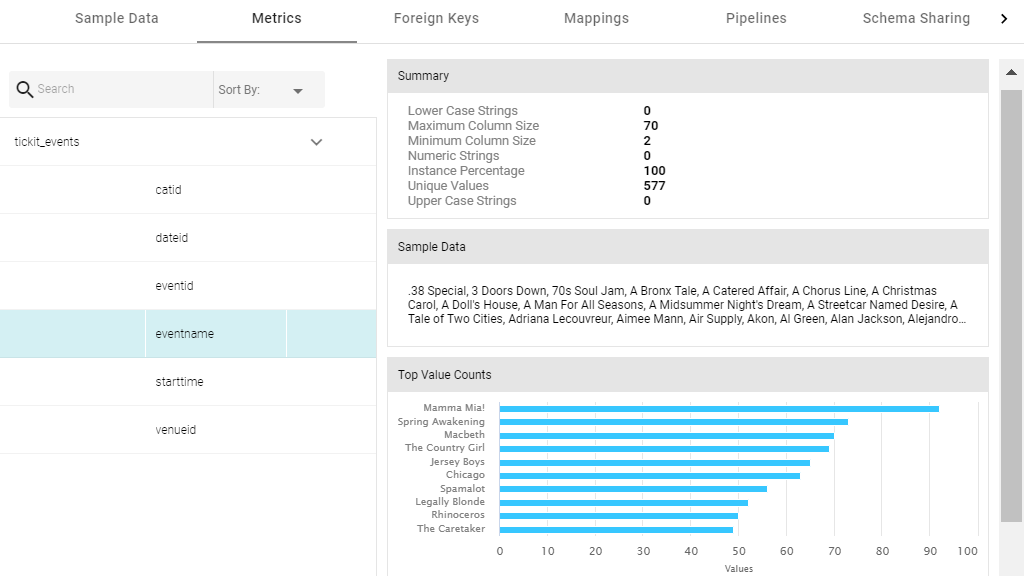
Depending on the data type of the column, one or more of the following metrics are shown:
- Extrema Metric: Shows the smallest and largest values.
- Median Metric: Shows the middle value.
- Mode Metric: Shows the value that appears most often.
- Unique Values Metric: Shows the number of unique values.
For additional metrics based on the type of data quality checks needed, contact Cambridge Semantics. For information about generating metrics for an onboarded Dataset, see Generating a Dataset Data Profile.