Introduction to the Anzo Application
This topic provides instructions for accessing the Anzo user interface and gives a general overview of the design and layout. For information about the Anzo concepts and procedures that influence the user interface's design and use, see Anzo Concepts and Vocabulary.
To access the user interface:
- Go to the following URL in your browser:
https://hostname
Where hostname is the Anzo server DNS name or IP address.
Your browser may warn you that the server’s SSL certificate has not been signed by a trusted authority. This is normal behavior. To continue, click the Advanced link at the bottom of the page and then click the Proceed link. If you require a trusted site certificate, you can obtain one from a Certificate Authority and add it to the Anzo server.
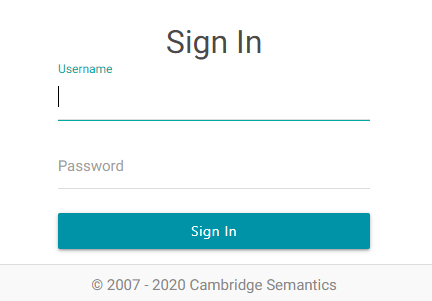
- On the Sign In screen, type your username and password and then click Sign In.
The user interface is organized and compartmentalized by the processes involved with building solutions. The design accommodates use cases where users with different permissions and responsibilities build various parts of a solution. The sections below introduce you to each of the user interface elements.
The following sections show an administrator view of the user interface. Depending on their assigned system role, some users might not see all components. For information about default Anzo roles and permissions, see Predefined Anzo Roles and Permissions in the Anzo Deployment and User Guide.
General Interface Elements
Each time you log into the application, the Home page is displayed and provides links to the features the logged in user has access to. Below the icons is a dashboard that displays an overview of the system artifacts and recently updated or bookmarked items. The dashboard becomes populated once you start onboarding Data Sources.
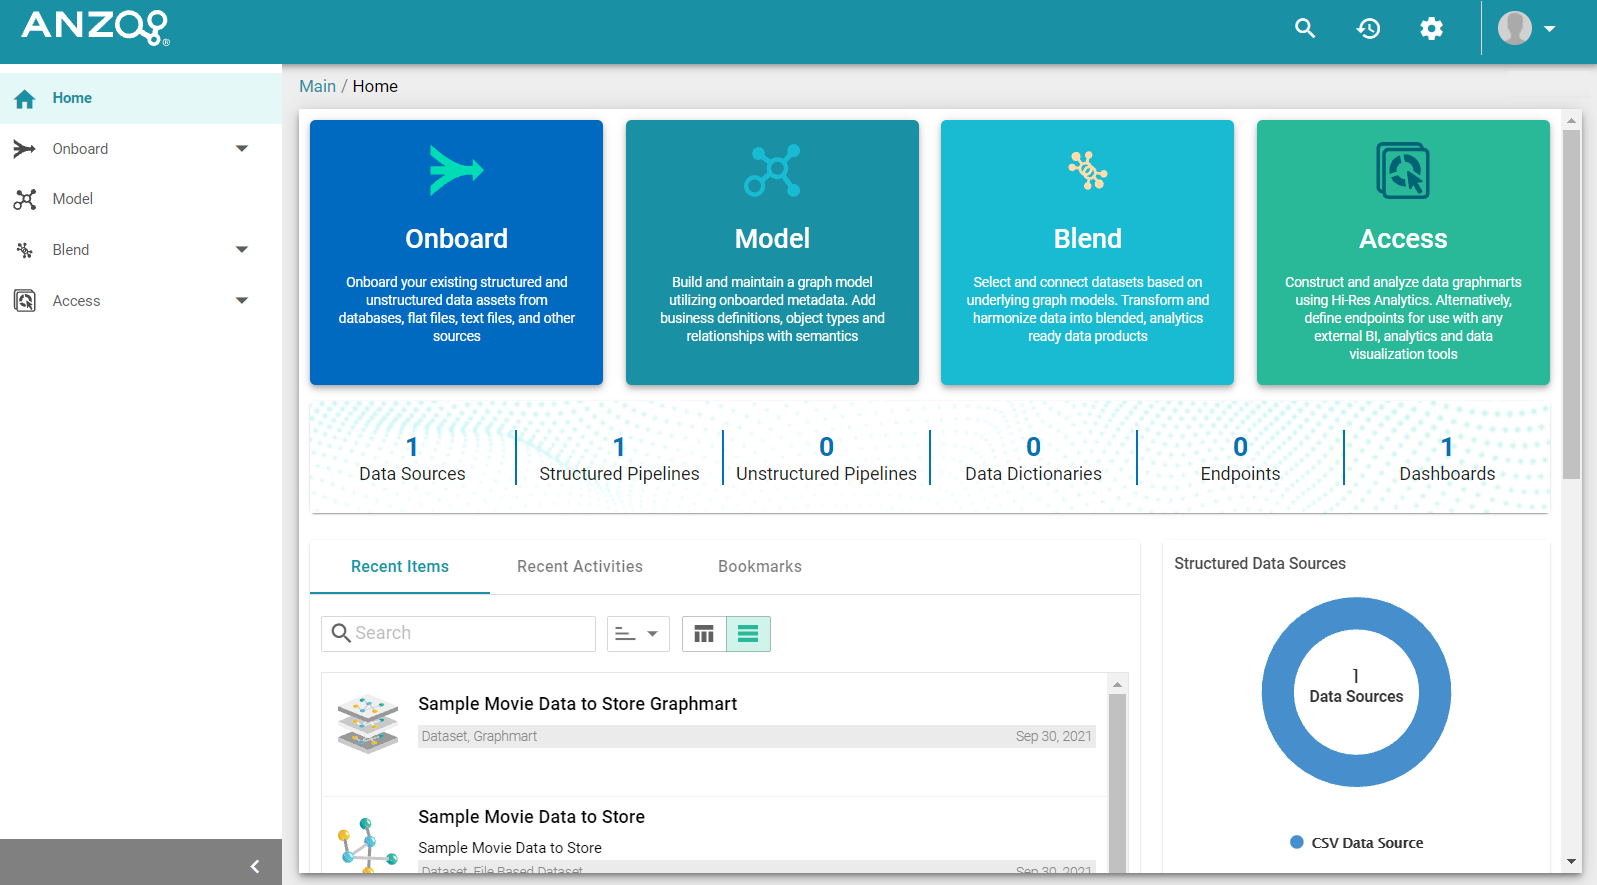
On the bottom left, you can click the collapse icon (<) to expand and collapse the left navigation menu. The right side of the top menu bar includes the following options:
- The Search icon (
 ) opens the Search dialog box where you can do a global search for a resource, such as a Data Source, Dataset, Graphmart, or Schema, by title. The Search field accepts wildcard characters.
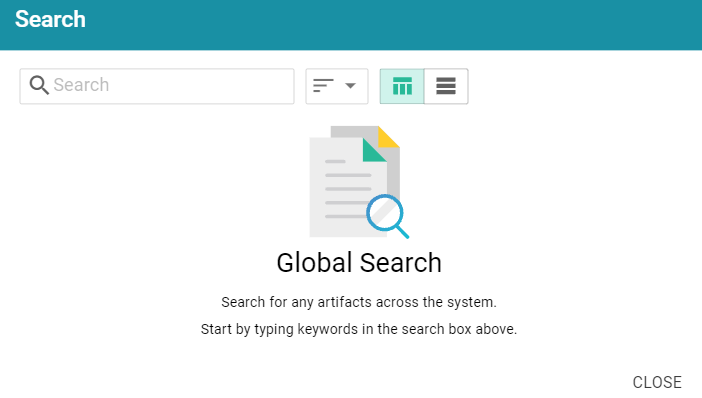
- The Activity Log icon (
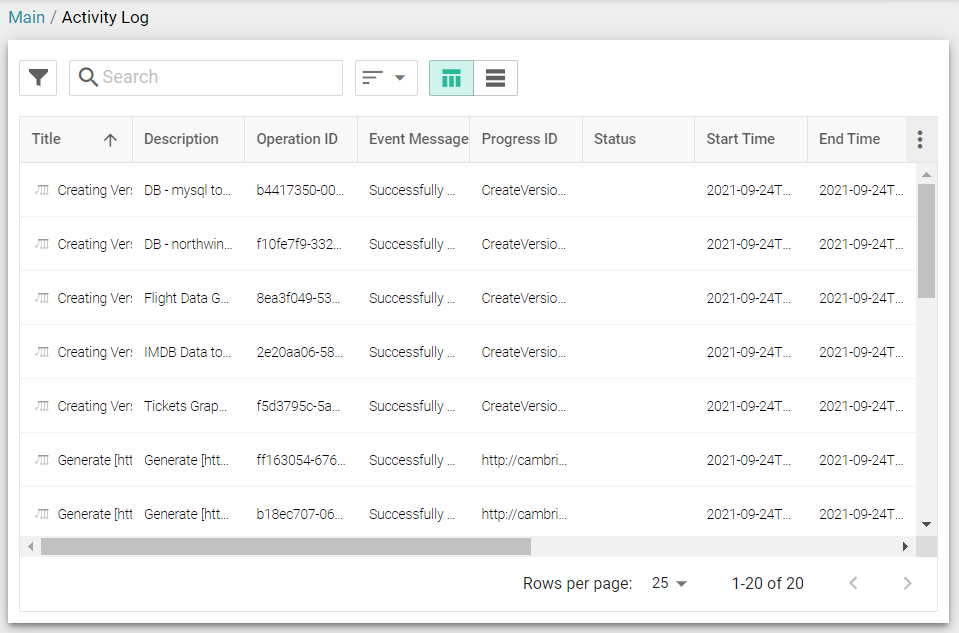
 ) opens the Activity Log, which offers a high-level view of individual activities, such as ETL engine and AnzoGraph usage and pipeline activity. The ability to filter activities based on their status and type enables users to drill down to activities of interest as well as profile user behavior. Additionally, the ability to include system data expands the scope of monitoring and aids in troubleshooting.
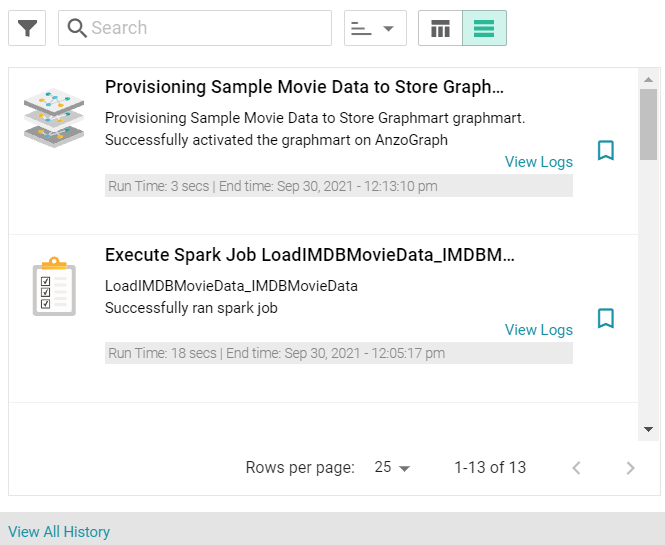
Once you start using Anzo and there are events that show up in the log, you can click View All History to open the full log for searching and filtering.
- The Administration icon (
 ) opens the Administration menu. Clicking a menu option opens the Administration user interface for managing Anzo server settings, connections, users, and other components.
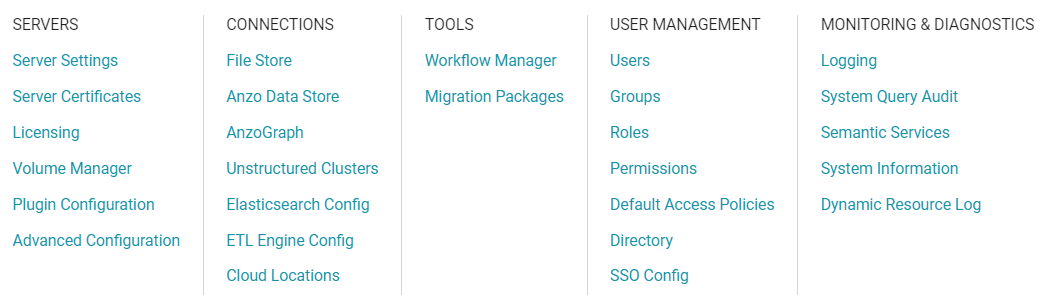
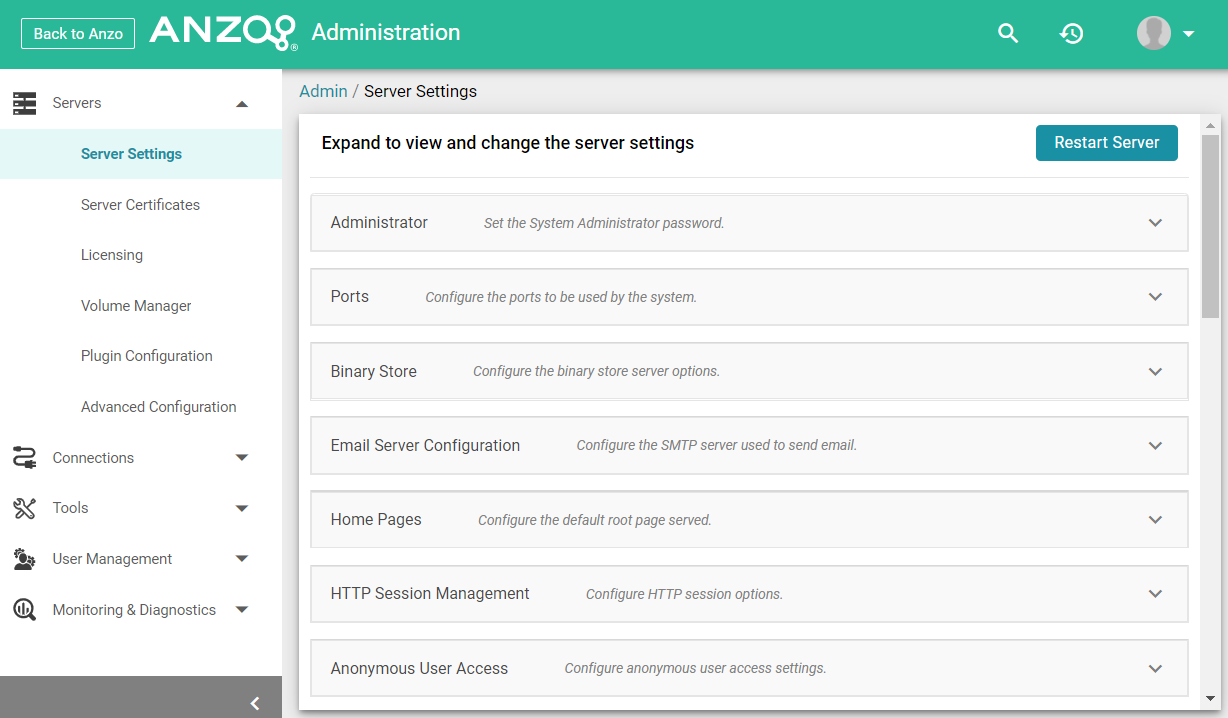
For information about the Administration application, see the Administration Guide in the Anzo Deployment and User Guide
- The User menu (
 ) provides access to your user profile, the About screen, and the Application Progress window, which lists recent application activity. It also includes the ability to log out of the application and a Documentation link that opens this guide.
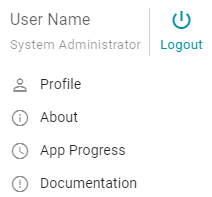
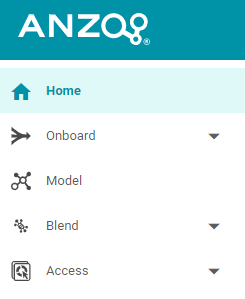
The navigation menu on the left provides access to all of the Anzo features.
Onboard
The Onboard menu provides access to the components that users configure to ingest data from various sources.
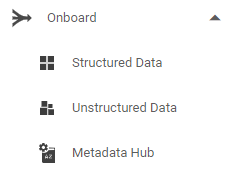
Structured Data
From Structured Data, users access Data Sources, Schemas, Mappings, and Pipelines for structured data sources: database connections, CSV, JSON, XML, Parquet, and SAS files.
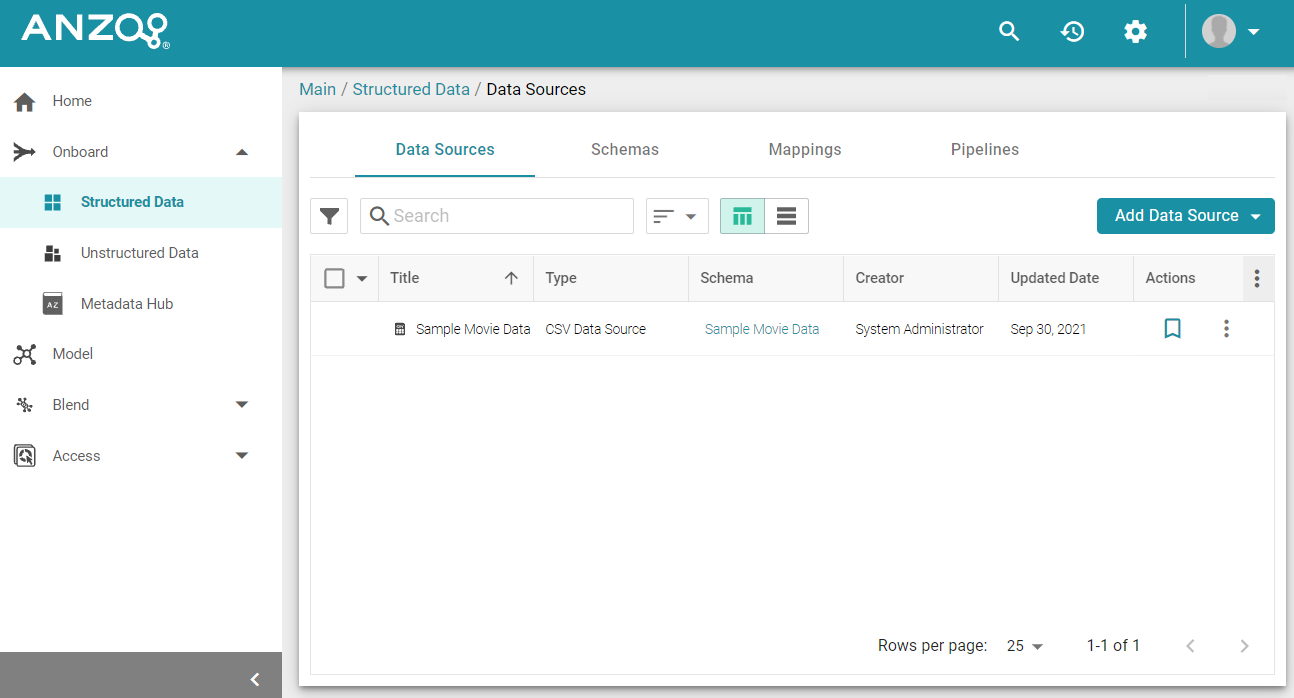
Data Sources
From the Data Sources tab, users connect to the files and databases that contain the data to onboard:
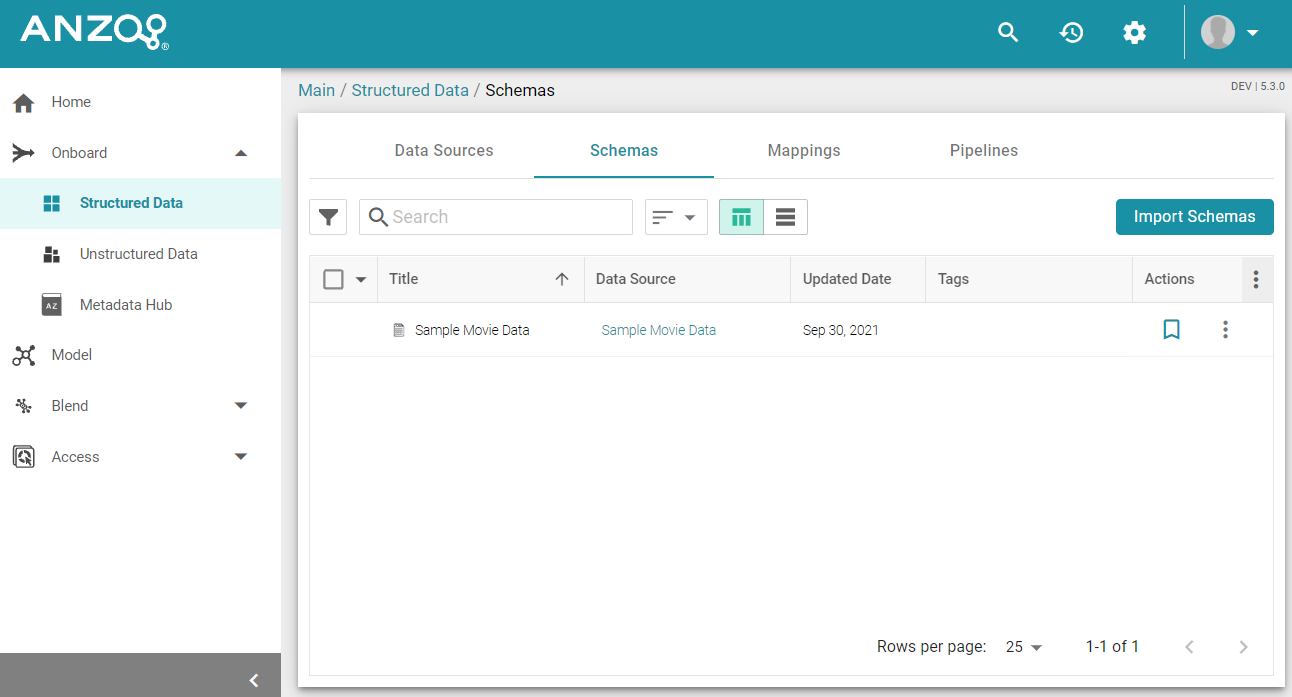
Schemas
From the Schemas tab, users view, create, and manage the Schemas that define the data to onboard:
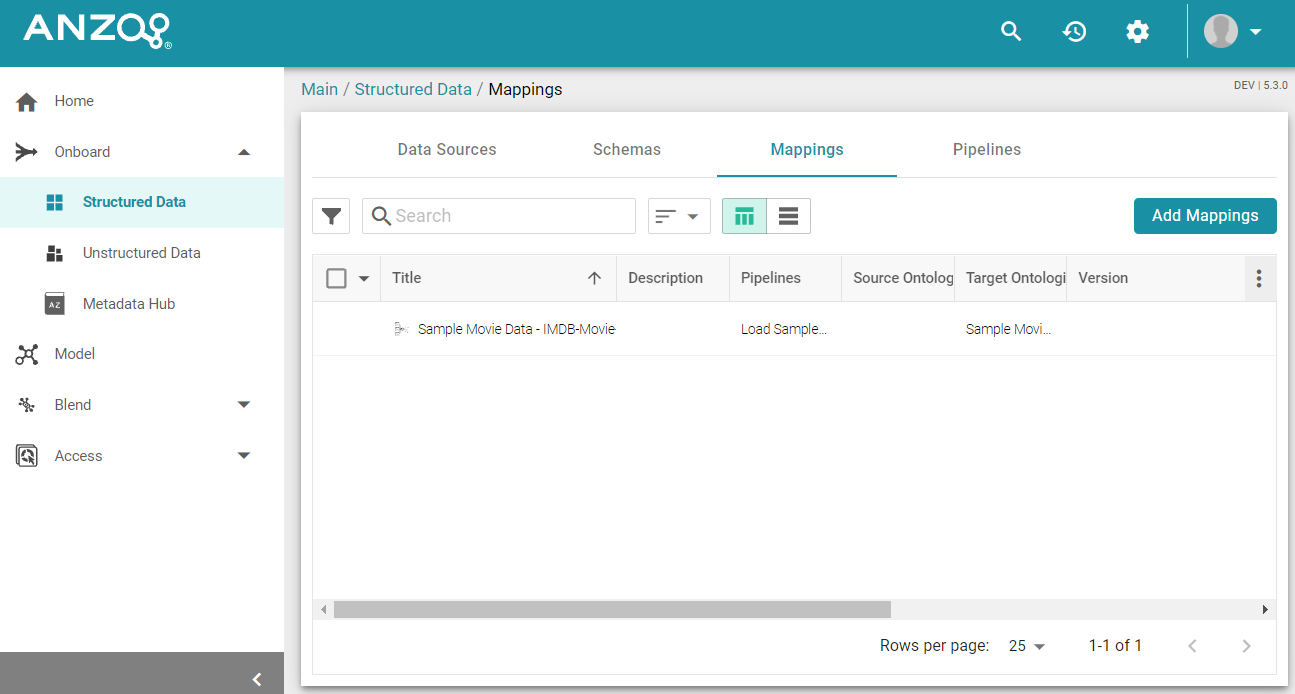
Mappings
From the Mappings tab, users view, create, and manage the Mappings that describe the relationships between Schemas and Data Models as well as perform optional transformations on the source data:
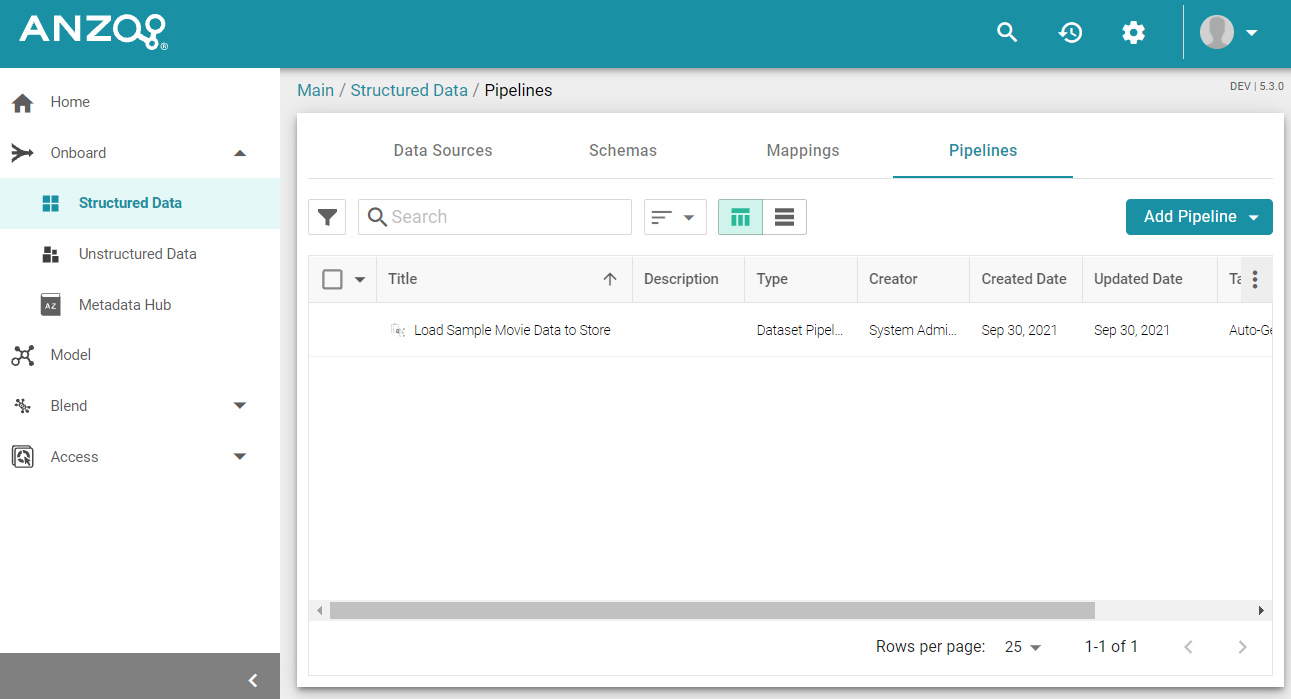
Pipelines
From the Pipelines tab, users view, create, and manage the Pipelines that run ETL jobs to onboard data into Anzo:
Unstructured Data
From Unstructured Data, users access and create Pipelines for onboarding data from Unstructured sources such as Office documents, PDFs, web pages, email messages, and knowledgebases.
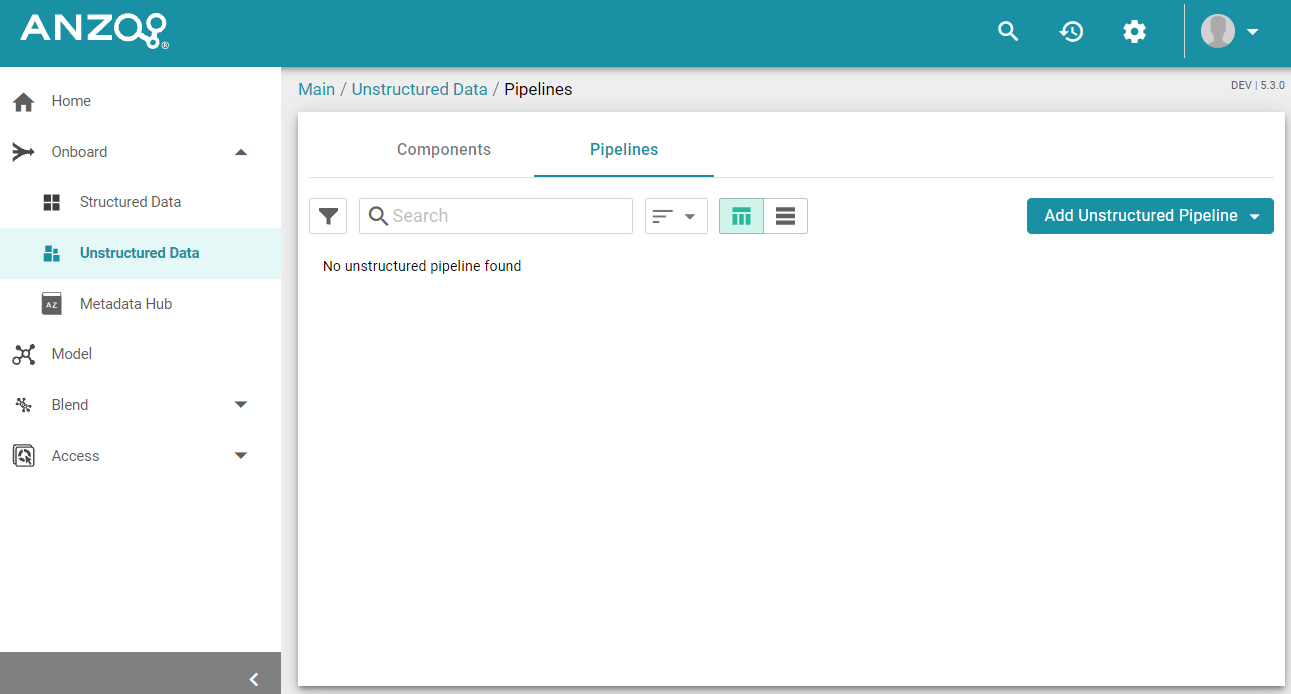
Pipelines
From the Pipelines tab, users can create and manage unstructured pipelines:
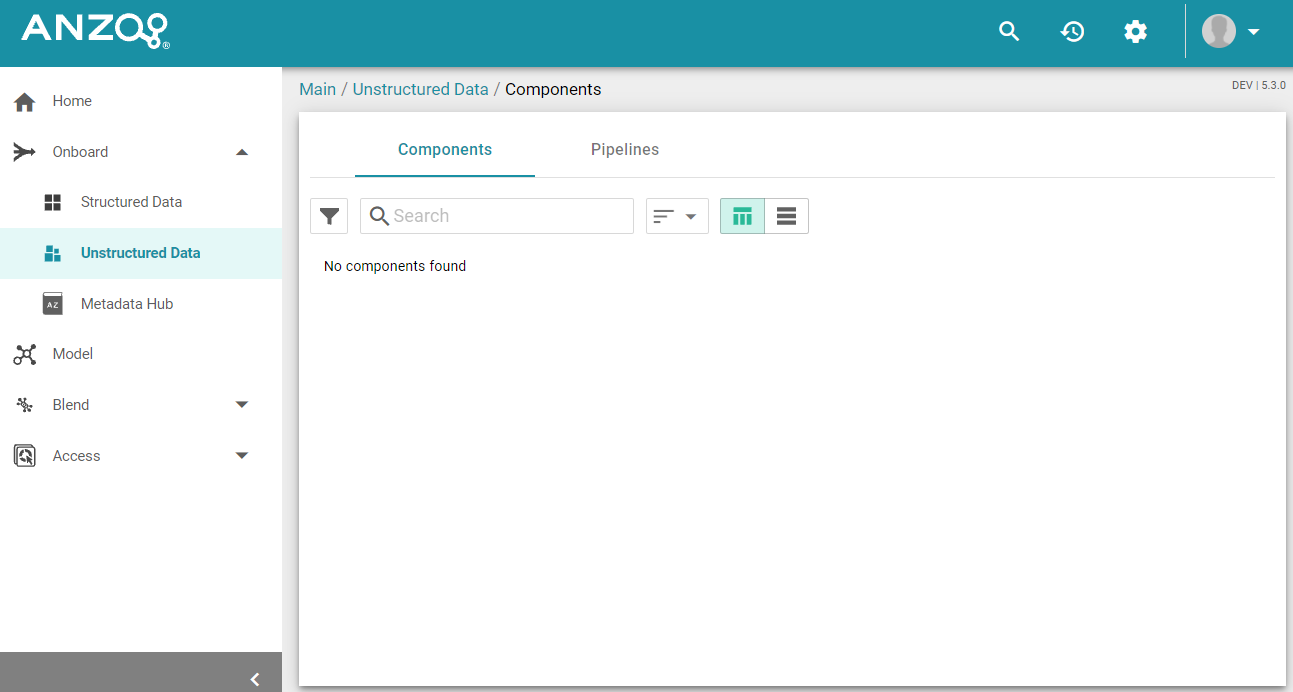
Components
From the Components tab, users can view and configure Unstructured Pipeline components:
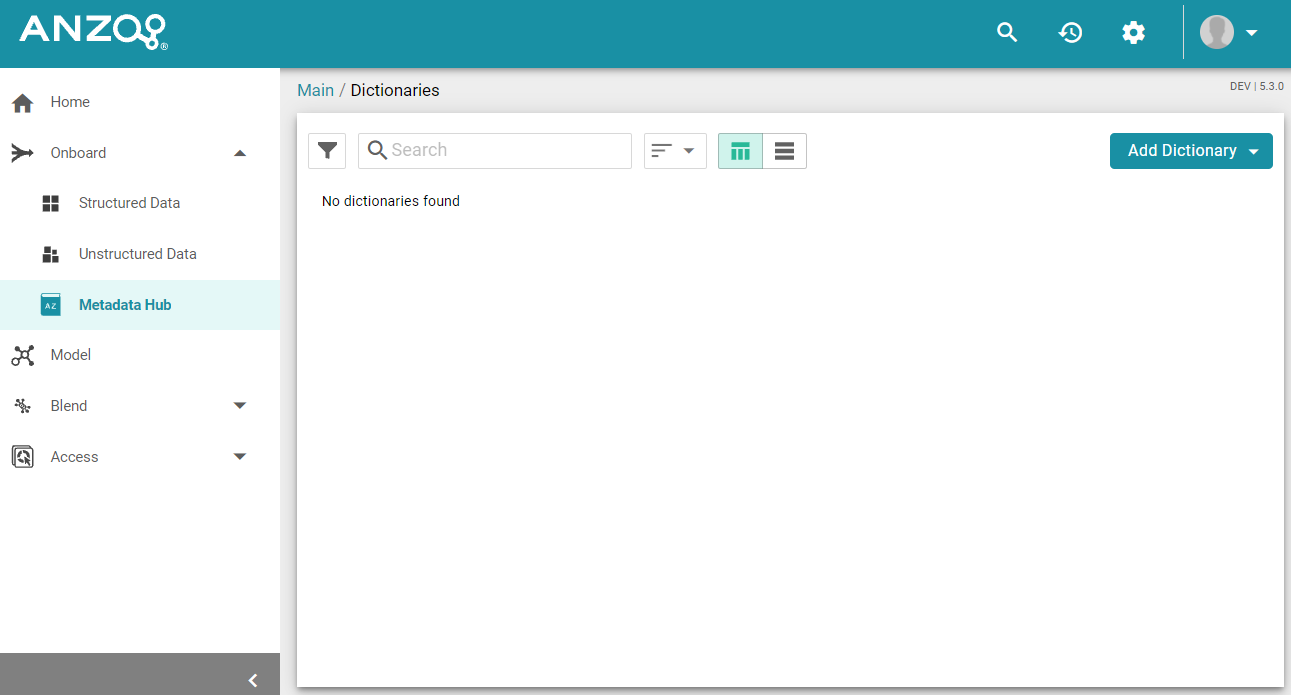
Metadata Hub
By default, the Metadata Hub is available only to the sysadmin user. Whether you can access Metadata Hub depends on whether the sysadmin user has enabled the feature for additional users or groups.
From Metadata Hub, users view, create, and manage Metadata Dictionaries, which define and normalize concepts across Data Sources.
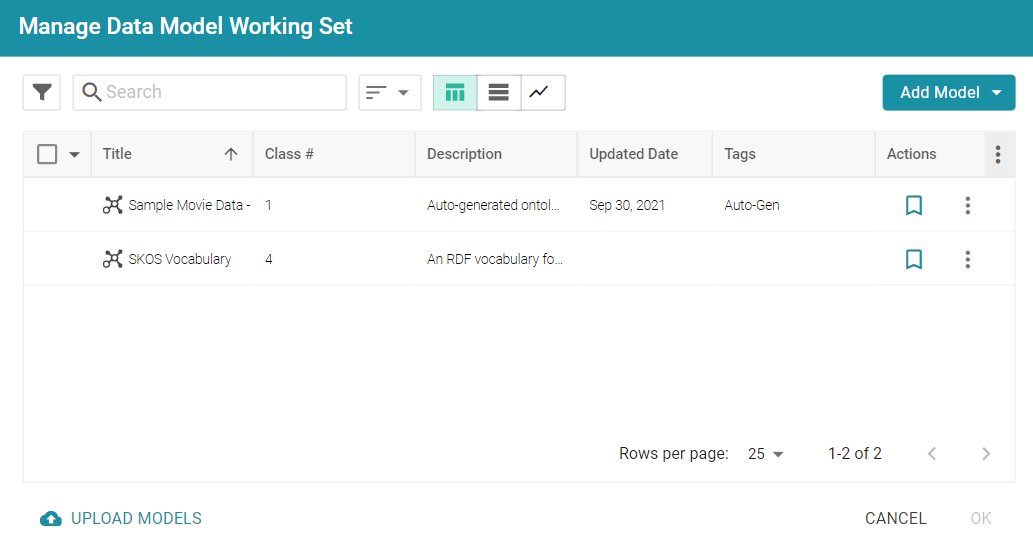
Model
The Model manager enables users to view, create, and manage Data Models, which describe the concepts, attributes, and relationships in or across datasets.
Blend
The Blend menu provides access to features that combine various datasets from different sources.
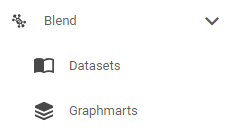
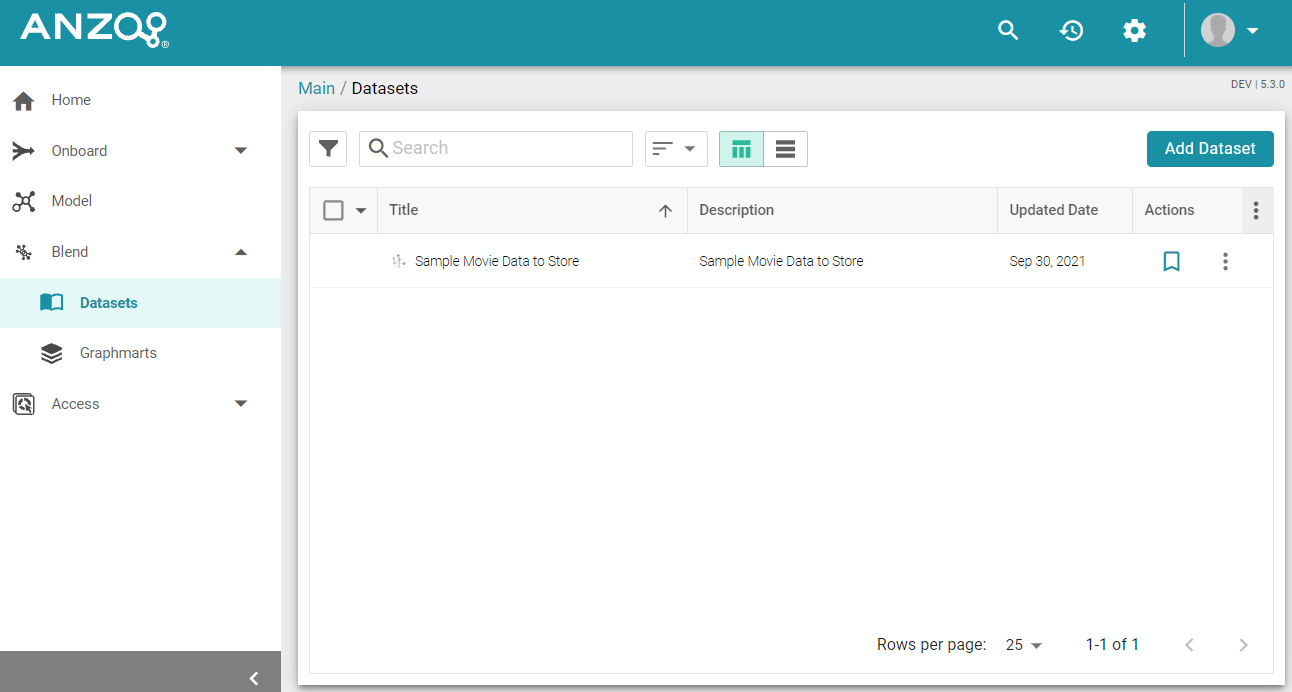
Datasets
The Datasets catalog is an inventory of all of the data in Anzo. Users can sort the list by tags, classes, and Dataset creators. Users can also add Datasets to Graphmarts for loading into AnzoGraph and then designing Hi-Res Analytics dashboards.
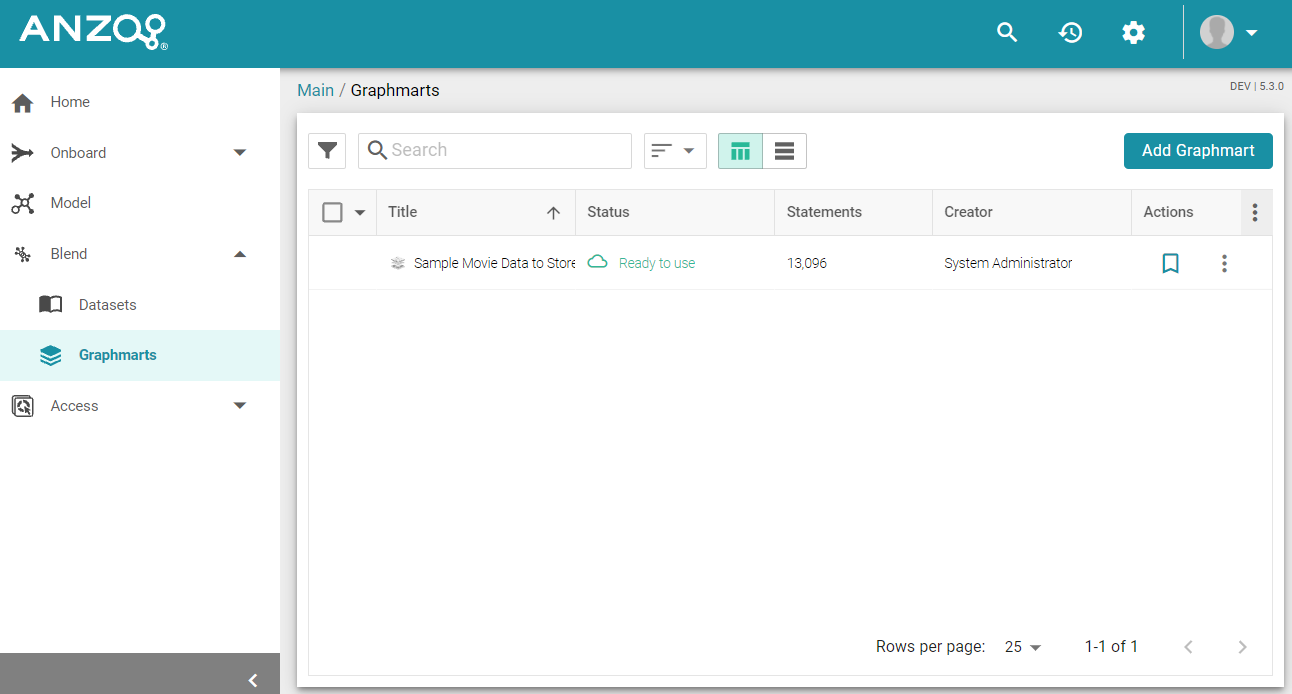
Graphmarts
The Graphmarts page lists all of the existing Graphmarts. Users can designate favorites and sort the list by tags and Graphmart creators. Users can click a Graphmart in the list to view details such as the Datasets included in the Graphmart, Data Layer details, and associated dashboards.
Access
The Access menu provides quick access to commonly used features.
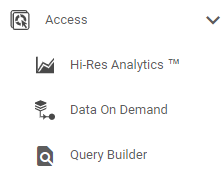
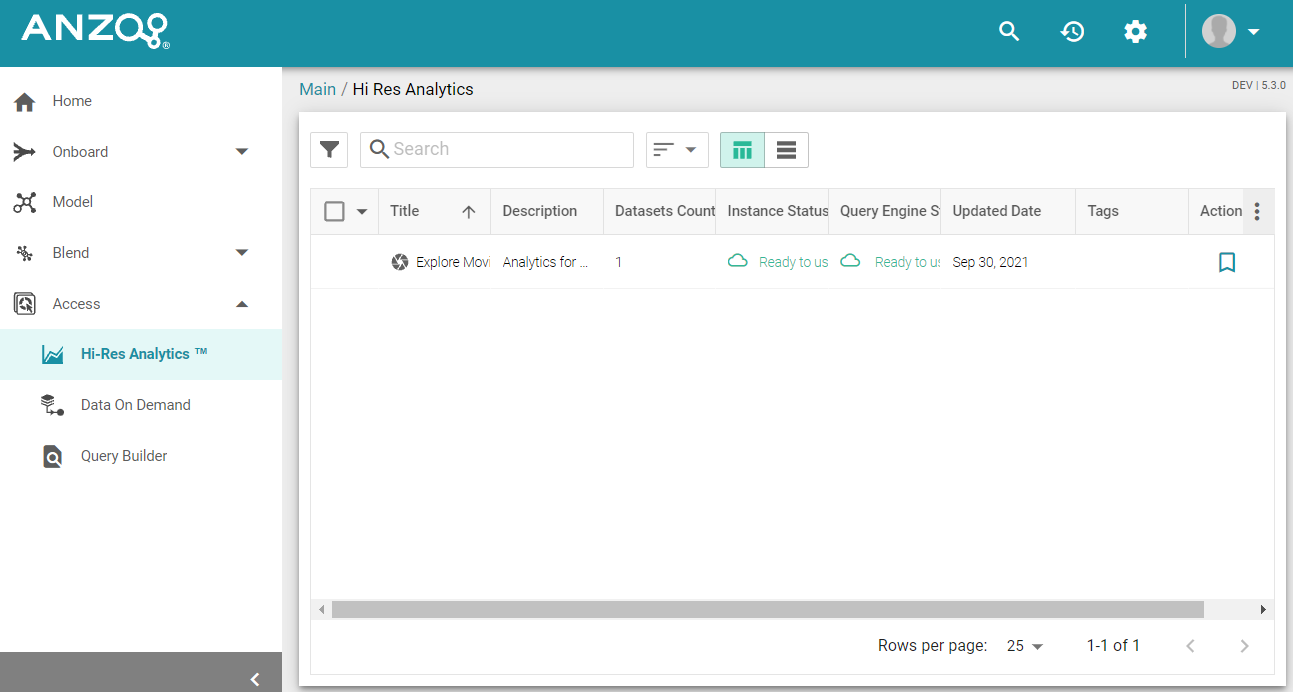
Hi-Res Analytics
The Hi-Res Analytics page lists all of the existing Dashboards. Users can click a Dashboard in the list to open it in the Hi-Res Analytics application. Users can designate favorites and sort the list by tags, Graphmarts, and Dashboard creators.
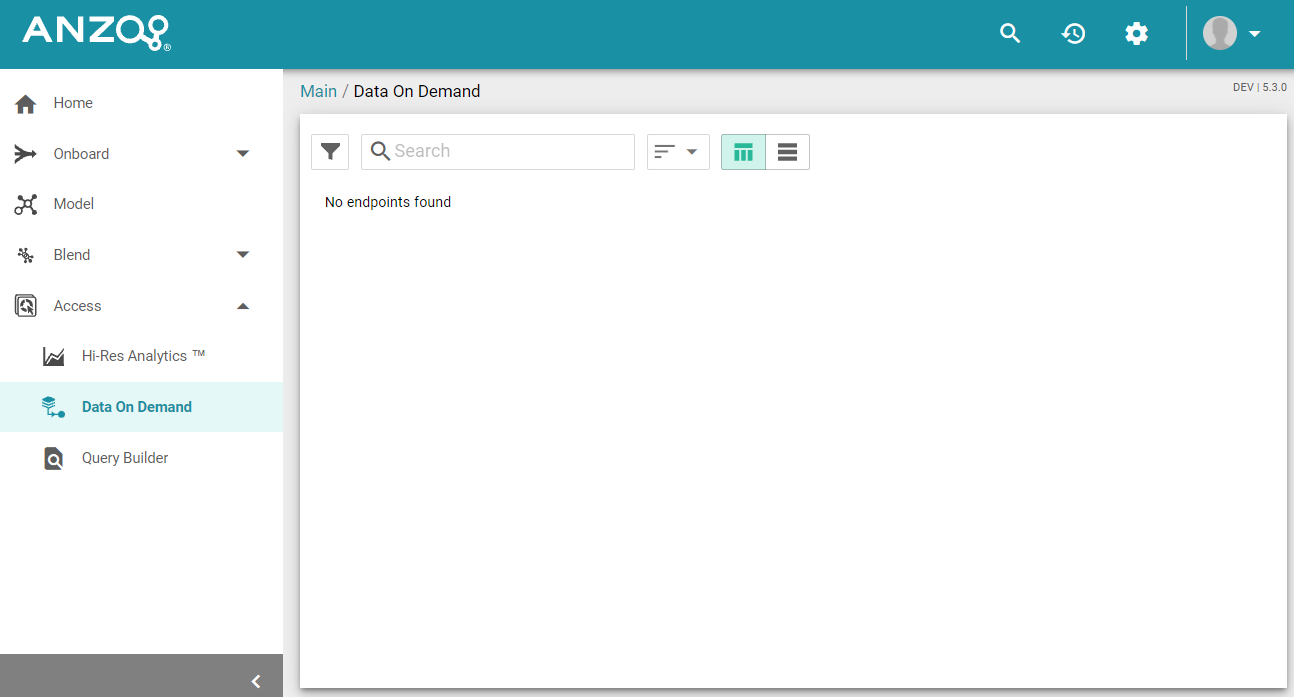
Data On Demand
The Data On Demand page provides a list of the Data on Demand endpoints that have been created.
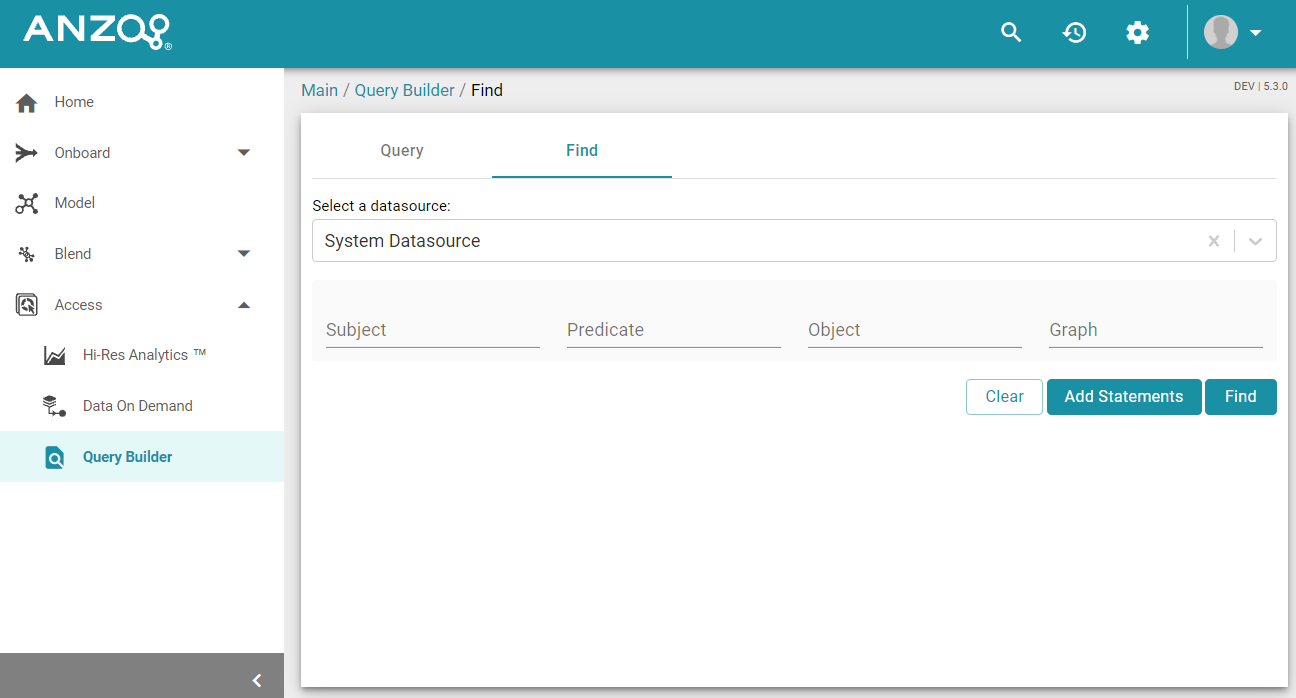
Query Builder
The Query Builder provides options to write and run SPARQL queries or find quads.
Query
The Query editor provides syntax assistance, type-ahead suggestions for Model entity names, and automated prefix creation and query formatting for readability. It also includes the option to save queries for later use.
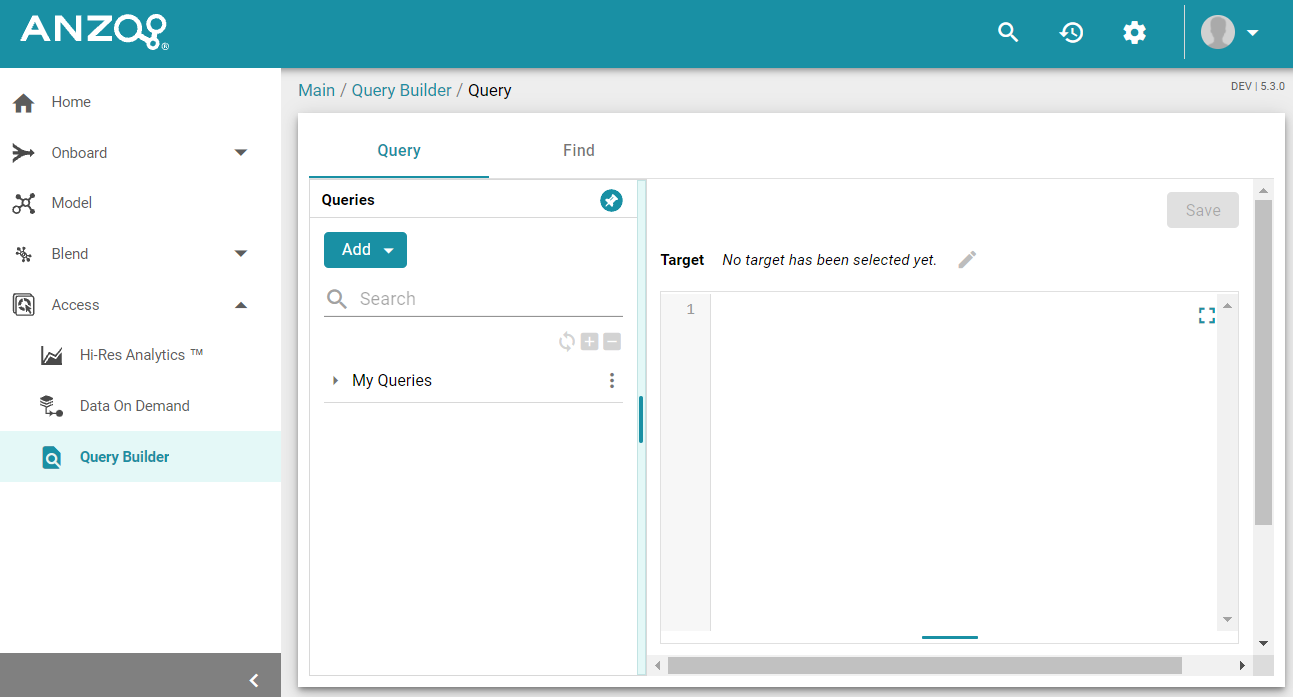
Find
The Find page enables users to search for quads by specifying a single subject, object, predicate, or graph name.