System Query Audit
The System Query Audit screen enables administrators to quickly view a log of query events, query errors, the duration time for the longest running queries, and a list of any queries that have been blacklisted. The audit log also includes a Queued Queries tab that displays a list of the queries that are queued behind currently running queries. Administrators can cancel queries from the list and remove them from the queue. This topic provides information about using the System Query Audit log.
Viewing the System Query Audit Log
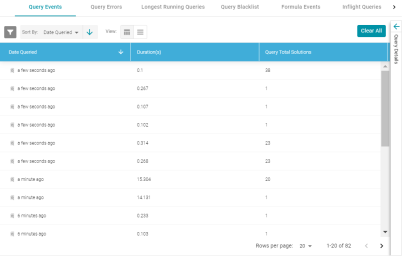
In the Administration application, expand the Monitoring & Diagnostics menu and select System Query Audit. Anzo displays the Query Events log. For example:

By default, the log shows an overview of all query events for all data sources. The table lists the date queried, the duration in milliseconds, and total number of solutions returned for each query event. You can select an event in the table to view details about that event, such as the target data source and query text, on the right side of the screen.
The System Query Audit log does not report on queries that complete in less than 100 milliseconds. In addition, queries that reuse the query cache from a previous run are not captured in the log. However, if a query takes less than 100 ms and uses cache, the original entry for the query is updated to increase the Cache Hit count.
AnzoGraph Detailed Query Timing Reference
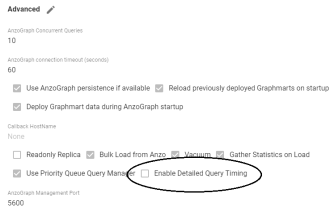
In the Advanced settings for the AnzoGraph connection configuration, there is an Enable Detailed Query Timing setting (shown in the image below) that controls the level of information that is displayed for AnzoGraph queries in the System Query Audit log. This section describes the differences in logging when the setting is enabled and disabled.

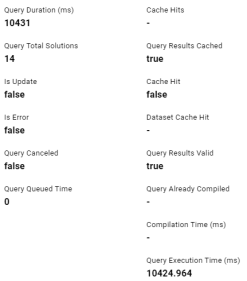
Enable Detailed Query Timing is disabled by default, meaning that Anzo will not run the additional statistics gathering queries unless you enable the setting. When Enable Detailed Query Timing is disabled, the System Query Audit log displays fewer query timing details. For example, the images in the table below show a comparison between the Result Details tab when Enable Detailed Query Timing is disabled versus enabled. When the setting is disabled, details such as query Compilation Time are not recorded.
| Enable Detailed Query Timing Disabled | Enable Detailed Query Timing Enabled |
|---|---|

|

|
In addition, the images in the following table show a comparison between the Query Statistics tab when Enable Detailed Query Timing is disabled versus enabled. When the setting is disabled, the Compilation Stats and Query Summary tables are empty.
| Enable Detailed Query Timing Disabled | Enable Detailed Query Timing Enabled |
|---|---|

|

|
To enable detailed query timing, edit the AnzoGraph connection and select the Enable Detailed Query Timing checkbox. You do not need to restart Anzo or AnzoGraph after changing the setting.
Enabling detailed query timing increases the AnzoGraph workload and may decrease overall query performance.