Generating a Source Data Profile
To help users assess the quality of the data coming from a data source, Anzo provides the ability to generate a Data Profile for each source. Creating a profile runs several metrics against the source data and reports statistics to help you assess data quality and perform data discovery. In addition to running the data quality analytics, you also have the option to configure the profile to generate a list of foreign key suggestions between schema tables that include the same column.
AnzoGraph uses the Graph Data Interface (GDI) Java plugin to connect directly to the data sources that you profile. The GDI plugin is included in the AnzoGraph installation. For file-based data sources, make sure the source files are available to AnzoGraph on the shared file store. For database sources, if you have configured custom drivers to access those sources in Anzo, the same drivers need to be added to AnzoGraph. For instructions, see Deploy Optional Drivers for Accessing Custom Database Sources.
Follow the instructions below to generate and review data profile metrics for a data source.
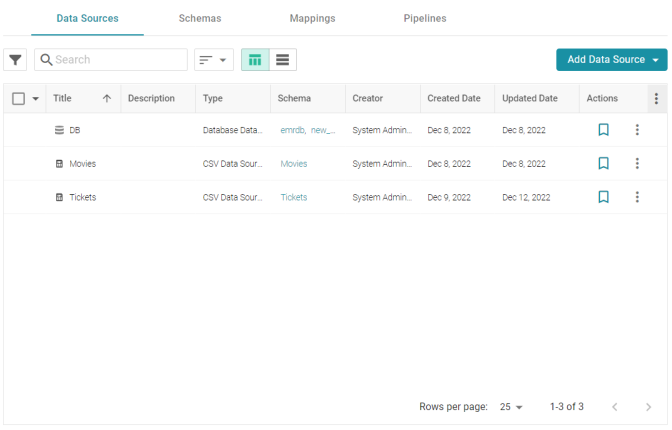
- In the Anzo application, expand the Onboard menu and click Structured Data. Anzo displays the Data Sources screen, which lists any existing sources. For example:
- Click the source that you want to profile. Anzo displays the Tables tab for the source, which lists the schema and table details. For example, the images below show the Tables tab for a database source:
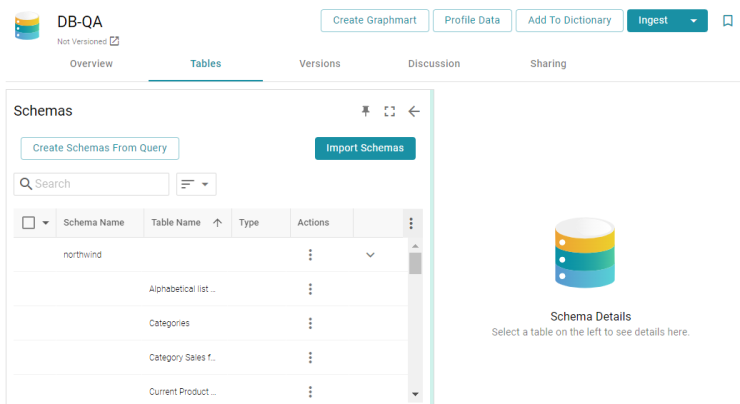
- Click the Profile Data button at the top of the screen. If the source is a database with multiple schemas, you are prompted to select the schema to profile. Select a schema and click OK. The Data Profile dialog box is displayed:
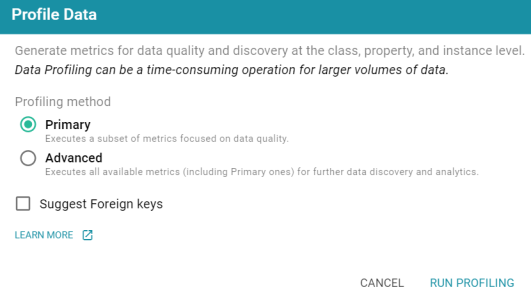
- On the Data Profile screen, choose the Profiling Method to use. The Primary method focuses on data quality type analysis. The Advanced method includes the Primary data quality analytics plus several advanced metrics for deeper data discovery and analysis. For details about the Primary and Advanced metrics, see Data Profiling Metrics.
To run the Advanced metrics, the optional AnzoGraph C++ extensions and dependencies must be installed. If you use dynamic, K8s-based deployments of AnzoGraph, the extensions are included. If you installed a static AnzoGraph instance with the installer, the C++ extensions are optional and are only installed if yes was specified for the
Do you want to install C++ UDXs packaged with AnzoGraph DB?prompt. For information about the C++ dependencies, see Install the Optional C++ Extension Dependencies. - If you would like the profiling process to generate a list of Foreign Key suggestions that you can review and activate later, select the Suggest Foreign Keys checkbox.
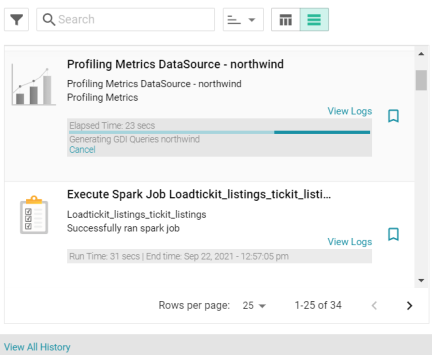
- Click Run Profiling at the bottom of the screen. Anzo provisions the source data into a temporary graphmart so that the metrics can be run by AnzoGraph. The profiling process may take several minutes, especially for large volumes of data. You can check the status of the process in the Activity Log. The Activity Log also presents the option to stop the profiling process by clicking Cancel under the progress bar for the task. For example:
- When the process is complete, select a row in the Schema for the profiled data source. Then click the Metrics tab on the right side of the screen. Anzo displays the metrics for the selected table. For example:
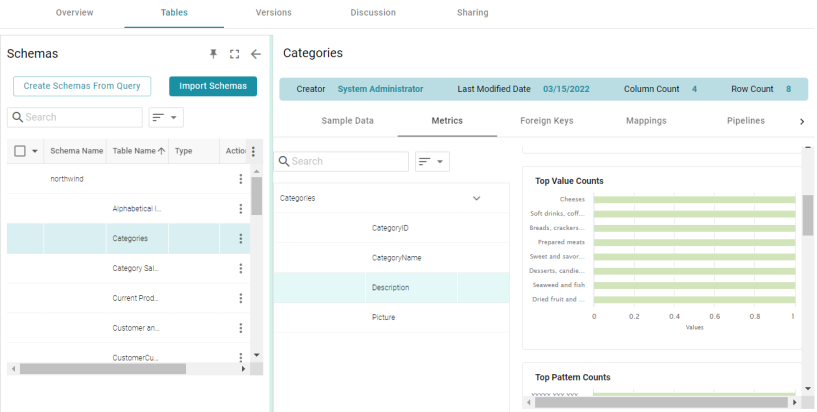
To view metrics for a property in the table, select the property in the middle of the screen.
For more information about the metrics that are displayed, see Data Profiling Metrics. For information about data profiling for datasets and graphmarts, see Generating a Dataset Data Profile and Generating a Graphmart Data Profile.