Creating a Network Navigator Dashboard
The Network Navigator Dashboard is an interactive graph visualization tool that enables you to find relationships in the knowledge graph and explore the paths to build out a Network View. This topic helps you get started building a Network Navigator Dashboard by covering the basic steps and functionality that is presented by default. Additional topics describe the functionality in further detail and cover more advanced dashboard configuration options. For instructions on creating a Graphmart dashboard, see Creating a Graphmart Dashboard.
By default, only the sysadmin user has permission to create a Network Navigator Dashboard. However, the sysadmin user can share created dashboards with other users and groups (see Sharing Access to Dashboards and Lenses).
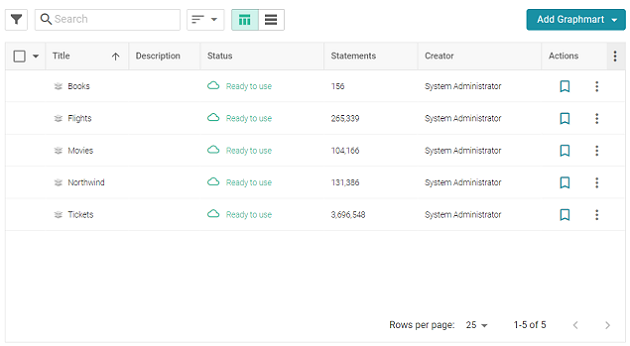
- In the Anzo application, expand the Blend menu and click Graphmarts. Anzo displays a list of the existing graphmarts. For example:
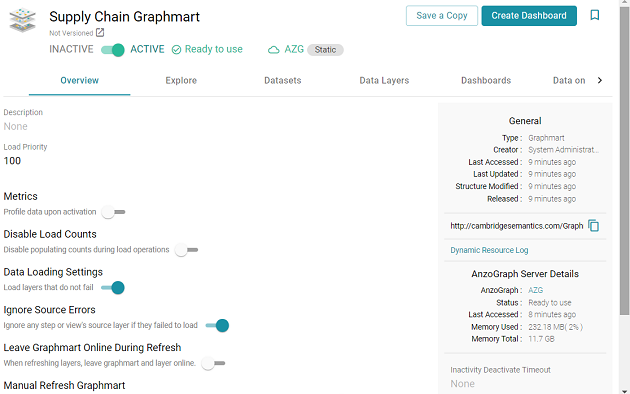
- On the Graphmarts screen, click the name of the graphmart for which you want to create a dashboard. The Overview screen is displayed. For example:
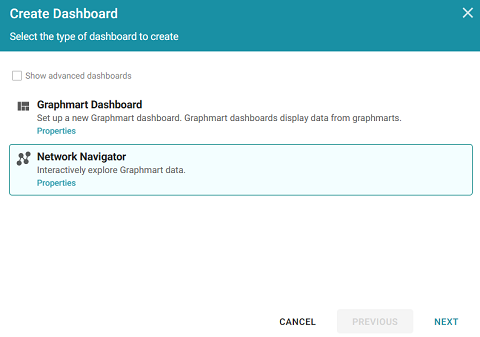
- Click the Create Dashboard button. The Hi-Res Analytics application opens and displays the Create Dashboard dialog box. Select Network Navigator Dashboard and click Next. Remember that only the sysadmin user has the option to create this type of dashboard. If you do not see the option and think you should, check with your system administrator.
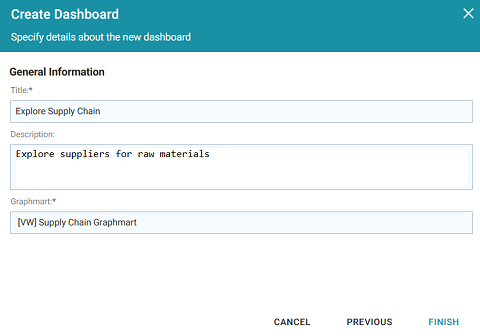
- Next, type a name for the dashboard in the Title field and enter an optional Description. For example:
- Click Finish to create the dashboard. The dashboard appears as a new tab in the application. For example:
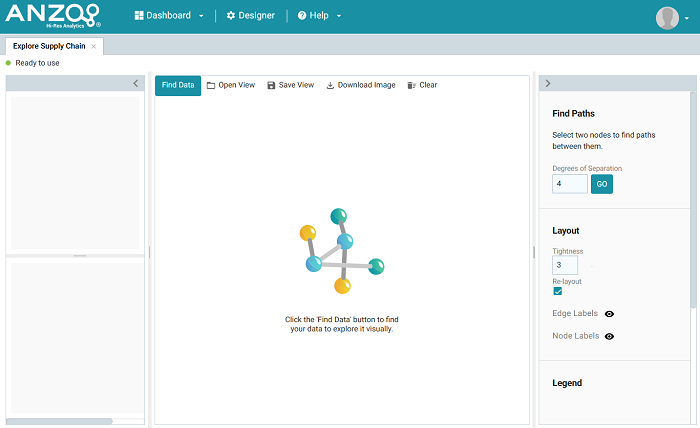
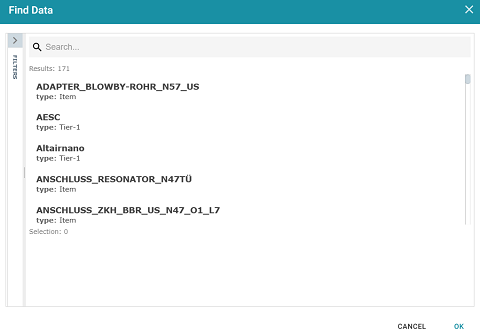
- The first step in rendering the Network View is to choose a node (or group of nodes) as the starting point. A node is an object in the data. In order to be able to traverse the network, start with an object for a property that has one or more relationships with other properties. To select a value, click the Find Data button at the top of the dashboard. The Find Data dialog box is displayed and lists all of the values for each of the properties in the data model. Select one or more objects in the list.
To narrow down the list of values by class or type of data, you can click Filter to open the Filter panel on the left side of the screen. The Filter panel lists the classes and subclasses from the model. For example, the image below shows the classes for a knowledge graph that contains supply chain data for an automobile manufacturer:
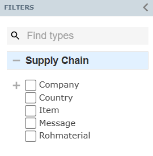
You can expand or collapse the classes to display or hide subclasses. And you can start typing text in the Find Types field to search for specific classes. Select the checkbox next to any of the classes from which you want to display data. The list in the main part of the screen is refreshed to display only the values for the properties in the selected classes.
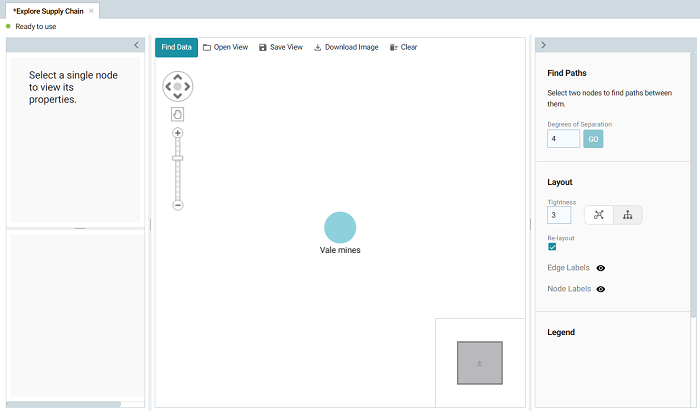
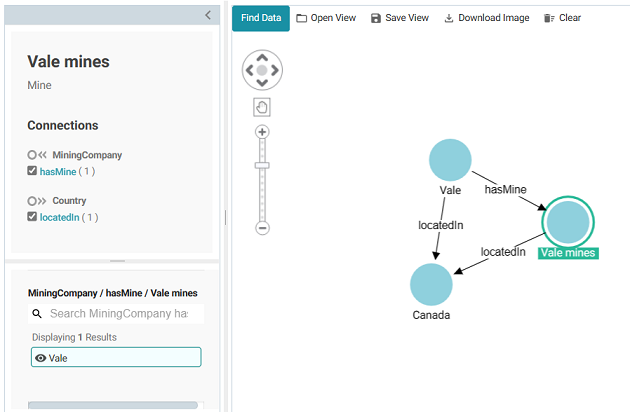
- Once you have selected the starting node in the Find Data dialog box, click OK to add the node to the Network View. For example, in the image below the value Vale mines was selected as the starting point, and the Vale mines node is added to the View:
You can configure the dashboard to Auto-Expand by a certain number of degrees or hops so that adding a node to a View automatically adds the specified number of related nodes and paths. For information, see Auto-Expanding a Network View.
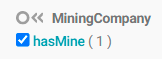
- To start building out the network, select a node to view its connections and properties on the left side of the screen. For example, selecting the Vale mines node shows its incoming and outgoing connections as well as properties like the label.
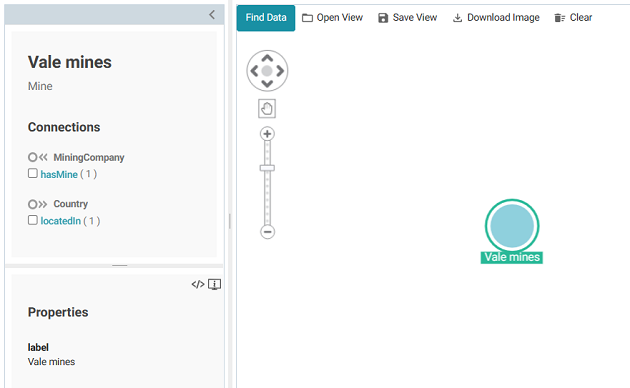
The image shows that Vale mines has an incoming connection (or backward path
 ) from Mining Company via hasMine and an outgoing connection (or forward path
  ) to Country via locatedIn.
 - There are two options for exploring the connections:
See a list of connected nodes without adding them to the View
To see a list of nodes that are connected by a path without adding the nodes and path to the View, you can click the path name link.
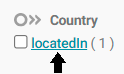
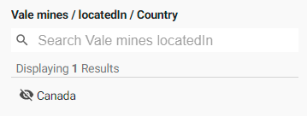
Details are shown in the lower panel, but the nodes are hidden from the network View by default. For example, clicking the locatedIn path from the image above, shows that Vale mines is located in Canada.
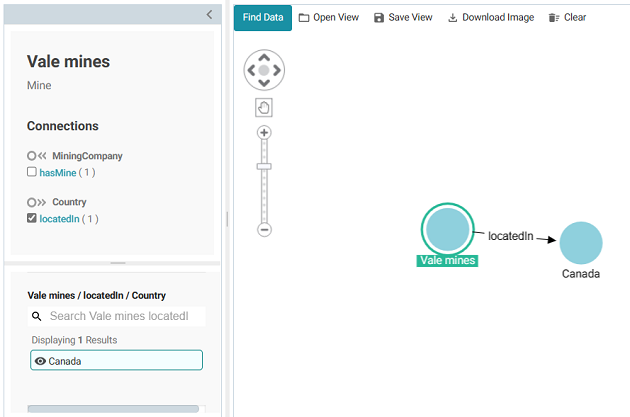
If you decide you want a node and path to be added to the View, you can click the hidden node to make it visible. For example, clicking Canada adds the path and node to the View:
Add a path and node directly to the View
To add a path and node directly to the network View, you can select the checkbox next to the path.
For example, selecting the hasMine checkbox adds the path and the MiningCompany value (Vale) to the View:
Any time you want to clear the View and start again, you can click Clear at the top of the screen. To toggle between showing and hiding a path or node, you can click the path or node in the panel on the left side of the screen to select or deselect the item.
You can save the View by clicking Save View and specifying a Title and optional Description in the dialog box. When you save the dashboard, the View that is visible at the time it is saved is presented when the dashboard is reopened.
- To continue to explore and expand the Network View, you can select another node and repeat the previous step to identify additional paths to follow. Or you also have the option to select two nodes and do a search for paths between them. To find paths, find and add to the view, if necessary, the two nodes whose relationships you want to explore. Then hold the Ctrl button and select the two nodes.
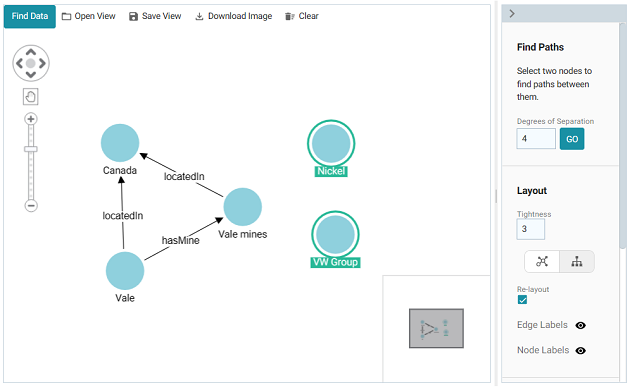
For example, in the image below, two nodes, an OEM called VW Group, and a raw material, Nickel, were added to the View, and both nodes are selected:
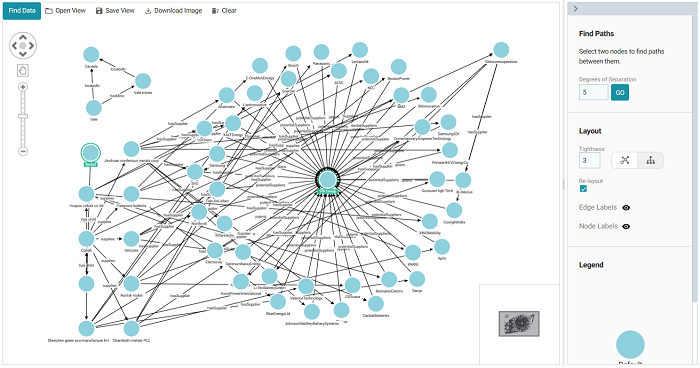
- On the right side of the screen under Find Paths, adjust the Degrees of Separation value as needed (the default is 4) and then click Go. Anzo runs an All Paths graph algorithm to find all of the paths that exist between the two nodes—where the maximum number of hops is the value in the Degrees of Separation field. If a "No paths found" message is returned, that means there is no path between the two nodes that is N or fewer hops away, where N is the value in Degrees of Separation. You can change the value and try again.
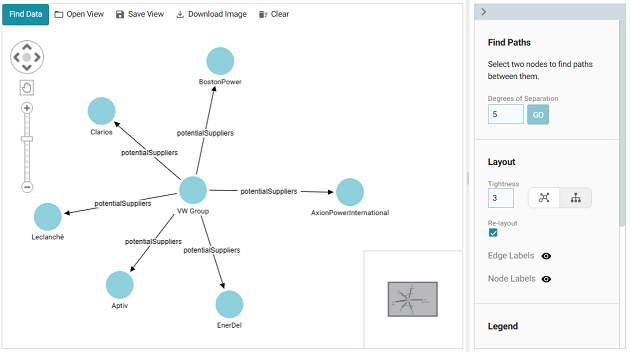
In the example for VW Group and Nickel, finding paths with the default value of 4 returned "No paths found." However, increasing Degrees of Separation to 5 renders several nodes and relationships.
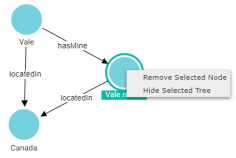
You can remove a single node or a hide a group of nodes by right-clicking a node and selecting an option from the pop-up menu (shown below). Remove Selected Node deletes the node and its incoming and outgoing connections. Hide Selected Tree hides the selected node and all of its connected nodes and paths.
- You can continue to explore the network using the methods described above. In addition, you can adjust the layout of the View using the options under Layout on the right side of the screen:
Tightness
The Tightness setting controls how close or far apart the nodes are. Valid values are 1 – 9. The lower the Tightness value, the looser the nodes are. Increasing Tightness brings the nodes closer together. Type a number in the field and then press Enter to apply it. In the simple example below, the default Tightness value of 3 shows nodes that are far apart.
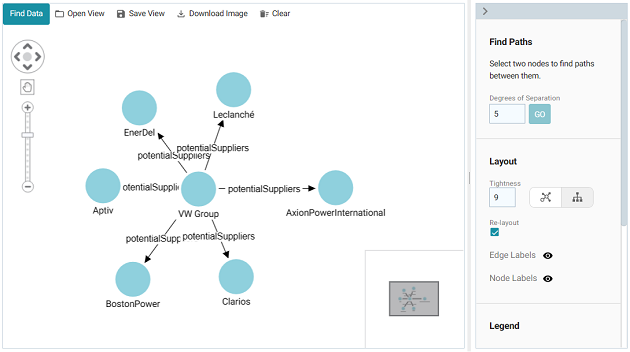
Increasing Tightness to 9 attracts the nodes closer together:
Standard vs. Hierarchical Layout
The layout buttons (shown below) enable you to switch between a Standard (
 ) layout (the default setting) and a Hierarchical (
 ) layout.
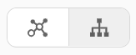
To change to a Hierarchical layout from a Standard layout, select the node in the View that is the root node and then click the Hierarchy (
) button. For example, in the image below, VW Group was selected as the root node. Changing to the Hierarchical layout changes the View to a hierarchy: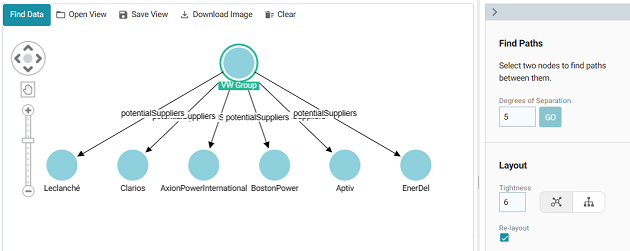
Re-Layout
The Re-Layout setting controls whether the entire View is refreshed and rearranged when a node is added. When Re-Layout is enabled, the View is rearranged when a node is added. If Re-Layout is disabled, new nodes are added to the View and existing nodes remain in place.
Show or Hide Edge and Node Labels
The Eye (
 ) icons next to Edge Labels and Node Labels enable you to toggle between showing or hiding the edge and node labels in the View.
You can save the View any time by clicking Save View. You are prompted to specify a Title and optional Description. To avoid creating multiple Views with the same name, make sure that you specify a unique Title. When you save the dashboard, the View that is visible at the time it is saved is presented when the dashboard is reopened. Other Views can be opened by clicking Open View and selecting a View. Only one View is displayed at time per dashboard. You also have the option to export a PNG version of the Network View by clicking Download Image.