Accessing a Data on Demand Endpoint
Since AnzoGraph's Data on Demand service conforms to the OData standard, any tool that supports the OData V4 REST API can access a Data on Demand endpoint to leverage data in AnzoGraph. This topic provides information about getting an OData connection string, endpoint authentication, and it includes examples of accessing endpoints from applications and programs. For instructions on creating endpoints, see Creating a Data on Demand Endpoint.
- Retrieving an OData Connection String
- Using Authentication
- Accessing an Endpoint from an Application
- Accessing an Endpoint Programmatically
Retrieving an OData Connection String
Follow the instructions below to retrieve the connection string to use for a Data on Demand endpoint.
- In the AnzoGraph user interface, click the Admin tab. Then click the OData (Preview) menu item. The OData REST Endpoint Configuration screen is displayed, which lists the existing endpoints. For example:
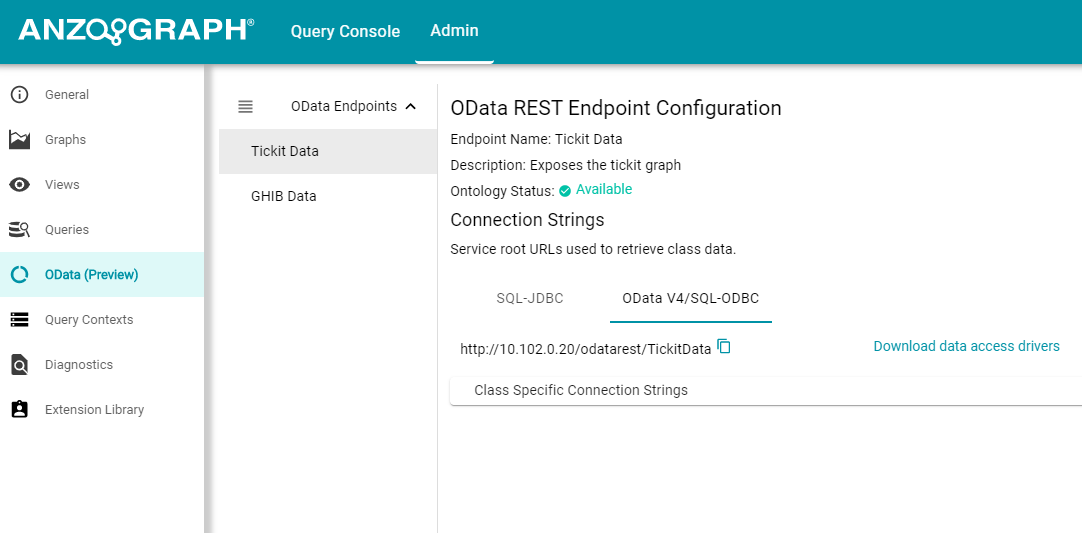
- If necessary, click the name of the endpoint for which you want to retrieve the connection string.
- To get the connection string for the entire graph or view that was exposed, use the OData V4/SQL-ODBC service URL that is listed under Connection Strings. For example:
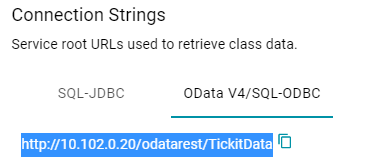 The SQL-JDBC option will be available in a future release.
 - If your application requires you to view one table at a time or you are only interested in viewing a specific class, click Class Specific Connection Strings to expand the field and view the connection strings for each class in the ontology. For example:
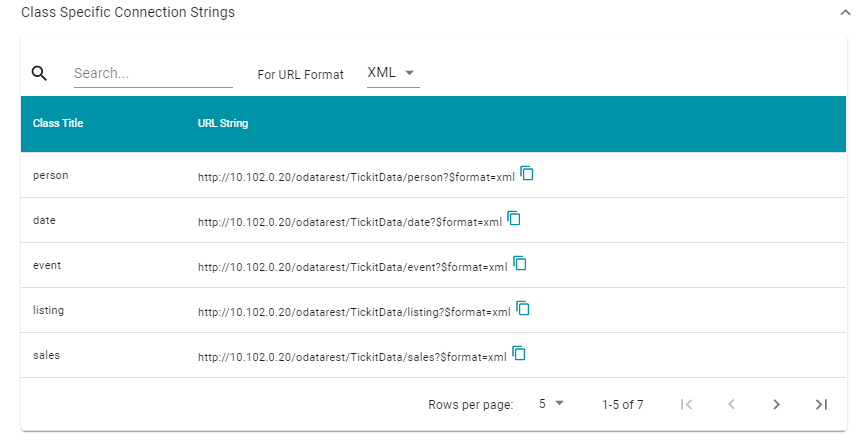
For convenience, the class-specific connection strings include the format parameter for specifying the output format. You can click the For URL Format drop-down list to set the output format to CSV, JSON, or XML.
Using Authentication
Connections to Data on Demand endpoints must be authenticated using Basic Authentication. Users can submit the AnzoGraph front end username and password when accessing data. These are the default credentials for the front end:
- Username: admin
- Password: Passw0rd1
Accessing an Endpoint from an Application
This section provides guidance on accessing a Data on Demand endpoint from an application that supports the OData REST API. It includes an example that configures an OData connection in TIBCO Spotfire. The example steps can also be applied to OData connections in other similar business intelligence tools.
The first step is to connect to the OData endpoint using the Spotfire Data sources user interface. When setting up the OData connection, the Service URL is the OData/ODBC URL from the Data on Demand endpoint configuration details in the user interface. The OData connection uses the AnzoGraph user interface credentials for authentication.
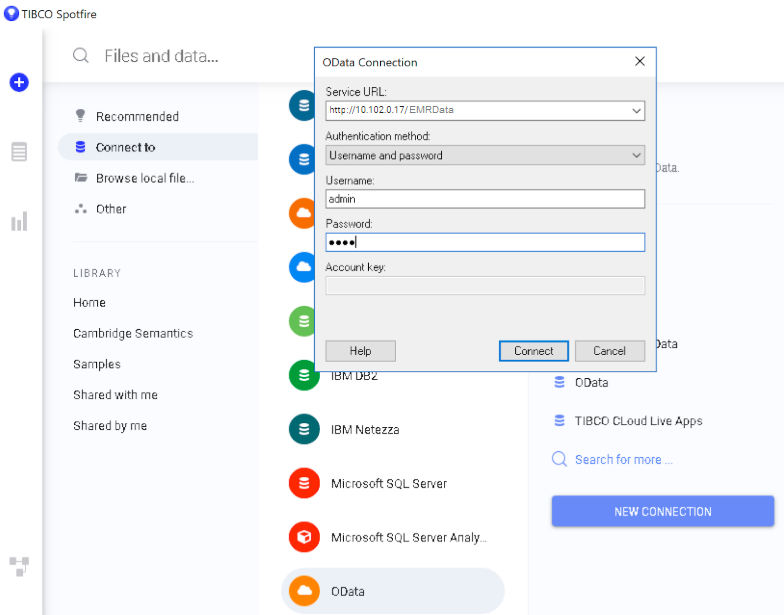
Once the connection is established, Sportfire prompts the user to select the classes and properties to work with. In this example, the FeatureID property from the Probe class and the symbol property from the Gene class are selected:
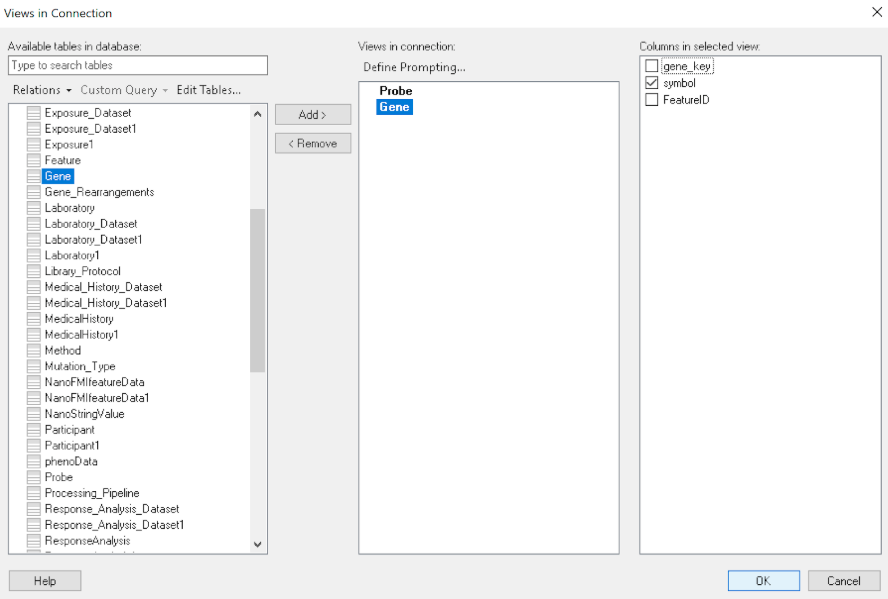
Once the properties are chosen, the data is loaded in Spotfire and can be used to inform existing analytics and data visualizations or create new ones.
Accessing an Endpoint Programmatically
This topic provides guidance on accessing Data on Demand endpoints programmatically by showing some example implementations using R and Python.
- Accessing an Endpoint with R (Through RStudio)
- Accessing an Endpoint with Python (Through a Linux Terminal)
Accessing an Endpoint with R (Through RStudio)
The following example shows how to connect to an OData endpoint from RStudio. The example uses the R programming language to access a Data on Demand endpoint and pull in data via a standard dataframe. New or existing R scripts can then be used with the data.
The first step in accessing data from RStudio is to prepare the R script that will construct the target URL and retrieve the resulting information via HTTP. The example script below accesses a pre-configured "SampleData" endpoint. The script has sections for filtering the results as well as expanding the selection to include information from multiple classes:
require("httr")
require("jsonlite")
require("rstudioapi")

user   <- rstudioapi::showPrompt("Username", "Enter AnzoGraph username", "admin")
pw     <- rstudioapi::askForPassword(paste("Enter password for",user,sep=" "))

## Data on Demand endpoint
odata  <- "http://10.100.0.10/odatarest/SampleData"

## Start from Probe class
startClass  <- "Probe?"

## Filter results for Homo sapiens species
filterKw   <- "$filter="
filterVal  <- "Species eq 'Hs'"
urlify     <- URLencode(filterVal)
filterStr  <- paste(filterKw,urlify,sep="")

## Select properties of interest (FeatureID) from base class
selectKw   <- "&$select="
selectVal  <- "FeatureID"
selectStr  <- paste(selectKw,selectVal,sep="")

## Select properties of interest (symbol) from Gene class
## via corresponds_to property on base Probe class
expandKw   <- "&$expand="
expandClass  <- "corresponds_to"
expandProps  <- "symbol"
expSelStr   <- "$select="
expandStr   <- paste(expandKw,expandClass,"(",expSelStr,expandProps,")",sep="")

## Specify format
format  <- "&$format=json"

## Generate OData URL using fragments above
url <- paste(odata,startClass,filterStr,selectStr,expandStr,format,sep="")

## Access OData endpoint
resultRaw  <- GET(url, (authenticate(user,pw, type = "basic")))
resultTxt  <- content(resultRaw, "text")
resultJson  <- fromJSON(resultTxt, flatten = TRUE)

print(url)

## Read results into dataframe
resultDataFrame  <- as.data.frame(resultJson)
View(resultDataFrame)
Executing the above R script from RStudio results in a dataframe that represents columns from the Probe and Gene classes.
Accessing an Endpoint with Python (Through a Linux Terminal)
Many users have existing Python scripts to use with data in AnzoGraph or a familiarity with Python that would make exploring, retrieving, and leveraging the data easier. The following example shows how to connect to an OData endpoint by executing a Python script from a Linux terminal.
The first step in accessing data using Python is to prepare the Python script that will construct the target URL and retrieve the resulting information via HTTP. The example script below accesses a pre-configured "SampleData" endpoint. The script has sections for filtering the results as well as expanding the selection to include information from multiple classes (the same filter and class properties that were used in the R example above).
import requests
import getpass
from urllib.parse import urlparse

un = getpass.getpass(prompt='Username: ')
pw = getpass.getpass(prompt='Password: ')

## OData endpoint
odata = 'https://10.100.0.10/odatarest/SampleData/'
# data on demand url

## Start from Lease class
startClass = "Probe?"

## Filter results
filterKw  = "$filter="
filterVal = "Species eq 'Hs'"
urlify    = urlparse(filterVal)
filterStr = filterKw + urlify.geturl()

## Select properties of interest (start date, missed payments, lease status) from base class
selectKw  = "&$select="
selectVal = "FeatureID"
selectStr = selectKw + selectVal

## Select properties of interest (name, social security number, credit score) from Individual class
expandKw  = "&$expand="
expandClass = "corresponds_to"
expandProps = "symbol"
expSelStr   = "$select="
expandStr = expandKw + expandClass + "(" + expSelStr + expandProps + ")"

## Specify format
format = "&$format=text/csv"

## Generate OData URL using fragments above
url = odata + startClass + filterStr + selectStr + expandStr + format

## Access OData endpoint
r = requests.get(url, auth=(un, pw), verify=False)

print("URL")
print(url)
print("CONTENT")
print(r.content.decode('unicode_escape'))
print(type(r))
print(type(r.content))
In this example, the output is returned in CSV format (rather than JSON, as in the R example).