Use the Query & Admin Console
This topic provides information about using the Graph Lakehouse front end user interface, referred to here as the Query & Admin Console.
Log in to the Console
The user interface supports the latest Safari, Google Chrome, Mozilla Firefox, and Microsoft Edge browsers.
- Depending on whether you deployed Graph Lakehouse using Docker, Kubernetes with Helm, or the RHEL/Rocky installer, follow the appropriate instructions below to access the user interface:
Deployment Instructions Desktop Container Engine You can use the desktop application to open the Graph Lakehouse container in a browser, or open a browser and go to the following URL: http://127.0.0.1.If you specified a port other than 80 for the host HTTP port when you deployed Graph Lakehouse, include that port in the URL. For example,
http://127.0.0.1:8888.Linux Container Engine If you are accessing a container image on a remote Linux host, note the IP address of the host, and then open a browser and go to the following URL: https://<host_IP_address>.If you mapped the container's HTTPS (8443) port to port 443 on the host when you deployed Graph Lakehouse, you do not need to specify a port. If you specified a port other than 443, include the port in the URL. For example,
https://10.100.0.1:8888.If you are using Docker locally on a Linux machine and need to know the IP address of the Graph Lakehouse container, you can run the following command:
sudo docker inspect <container_name> | grep '"IPAddress"' | head -n 1For example:
sudo docker inspect anzograph | grep '"IPAddress"' | head -n 1
"IPAddress": "172.17.0.2"
Kubernetes with Helm Using the Graph Lakehouse cluster or external IP obtained from the kubectl get servicecommand, open a browser and go to the following URL:https://<IP_address>.EL9 Installer Use the following URL to access the console: https://<host_IP_address>:<https_port>.If you use the HTTPS endpoint, your browser may warn you that the connection is not private. The warning is normal behavior. Graph Lakehouse servers use self-signed certificates, and browsers automatically trust only the certificates from well-known certificate authorities. For more information about certificate warnings, see Security Certificate Errors on the DigiCert website. Depending on your browser, follow the appropriate instructions below to either bypass the warning and continue to the console or configure the browser to trust the certificate:
- On Chrome, click the Advanced link at the bottom of the page and then click the Proceed to ip (unsafe) link.
- On Safari, click the Show Details button and then click Visit Website to import the certificate.
- On Firefox, click Advanced and then click Add Exception. On the next screen, click Add Security Exception to confirm the exception for the endpoint.
The browser displays the login screen.
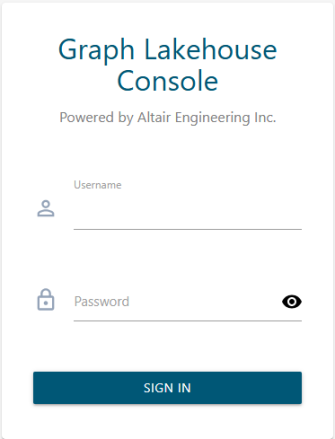
- On the login screen, type the username and password for the admin user that you set up during the deployment. For Docker installs, type admin as the user name and Passw0rd1 as the password.
- Then click Sign In. After successful authentication, the Query Console tab is displayed.
Tour the Console
The Query & Admin Console application top menu bar provides two tab selections, Query Console (Query Console Tab) and Admin (Admin Tab). On the right side of the screen, the top menu provides the DB Status option, the Server Context drop-down menu, and the user drop-down menu. The list below describes each item.

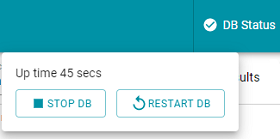
- DB Status shows the status of the database. A check mark icon indicates that the database is running, and an X icon indicates the database is stopped. Click DB Status to access the options to start, stop, or restart the database:
- The Server Context menu enables you to manage the connections to multiple Graph Lakehouse instances as well as set up an LDAP configuration for authentication.

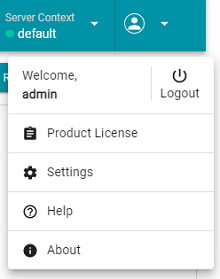
- The user menu includes options to log out of the console, view the product license, and access the documentation (Help). The Settings option takes you to the Server Configuration page for server context and LDAP configuration, and the About option displays information about the current Graph Lakehouse database and front end versions running in your environment. The Product License option displays information about the current Graph Lakehouse license and allotted resources. In addition, this option provides links to request new or enhanced licenses and upload new license keys. See Install or Upgrade a License for more information about licensing options and requesting a new license.
Query Console Tab
When you open the Query Console tab, the left sidebar navigation pane, labeled Query List, displays a number of predefined menu options and groups.
The Console provides two default queries, Count Statements and Total Statements. The Count Statements query returns a list of each named graph and the number of statements or triples in the graph. The Total Statements query returns the total number of statements in all named graphs.
Clicking the Add Query button lets you enter and run new queries and other SPARQL statements. The Add Group button lets to define new menu option groups to organize queries, and the More button lets you import from and export queries to your local file system environment. Clicking on the three-stacked dot icon (![]() ) next to an existing query lets you rename, export, or delete the query.
) next to an existing query lets you rename, export, or delete the query.
In the right side window, the Console provides an editing and display window along with various button, checkboxes, and windows, pertaining to your current sidebar menu or query selection. For example, if you've already loaded the sample tickit graph into Graph Lakehouse, selecting the Count Statements option would display the following:

At the top of the right-side window, the Console displays the Server Context drop-down menu, the Auto Clear Results checkbox and Run, Settings, and Copy buttons, which let you run the displayed query or perform other actions. If you choose the Add Query option, the Console clears the right-side query window, allowing you to enter a new query or SPARQL query.
As you enter a new query, the Console validates the syntax of the SPARQL statement you are entering. If you specify syntax that is invalid, the Console displays the invalid syntax in red. In that case, you can click on the red Info (![]() ) icon to see suggested or allowed syntax elements you can enter at a specific position in your SPARQL statement.
) icon to see suggested or allowed syntax elements you can enter at a specific position in your SPARQL statement.
Below the SPARQL query window, the Console displays the results from running a query, along with options to control the results format, limits to page size, and so on. You can toggle between Table and Response options, to show the query result in either a tabular format, or when you click Response, view the query result in the specified format, by default, JSON.
Admin Tab
When you open the Admin tab, the left sidebar navigation panel displays a variety of menu options pertaining to the common operations that an Graph Lakehouse administrator or analyst might perform. This section provides a basic description of each option and provides references to additional information.
General
The General tab selection displays the database and console version information, database start time, and license status. It also provides details such as the number of cores utilized on the Graph Lakehouse server or cluster, memory usage, and total memory resources available to Graph Lakehouse.

Clicking the Upgrade License button takes you to the Graph Lakehouse License Offerings web site, allowing you to view various product download and licensing options. For instructions on upgrading the license, see Install or Upgrade a License.
Graphs
The Graphs menu option displays a list of the graphs in memory as well as a count of the number of triples that each graph contains. For example:

If you want to delete a graph from the database, click the trash can icon (![]() ) in the row for the graph that you want to drop. The console displays a dialog box to confirm that you want to delete the graph. Click OK to remove the graph.
) in the row for the graph that you want to drop. The console displays a dialog box to confirm that you want to delete the graph. Click OK to remove the graph.
Views
The Views menu option displays a list of the views that have currently been defined in Graph Lakehouse. For example:

For each view, the display shows the view name, the type (materialized or non-materialized), and the query on which the view was defined. If you want to delete a view from the database, click the trash can icon (![]() ) in the row for the view that you want to delete. The console displays a dialog box to confirm that you want to delete the view. Click OK to remove the view.
) in the row for the view that you want to delete. The console displays a dialog box to confirm that you want to delete the view. Click OK to remove the view.
Queries
The Admin Queries menu option provides access to the query history log, which shows a list of the queries that have been run against Graph Lakehouse. To view the list, select the Queries menu option. The following display hows the query history and provides the option to cancel all running queries. For example:
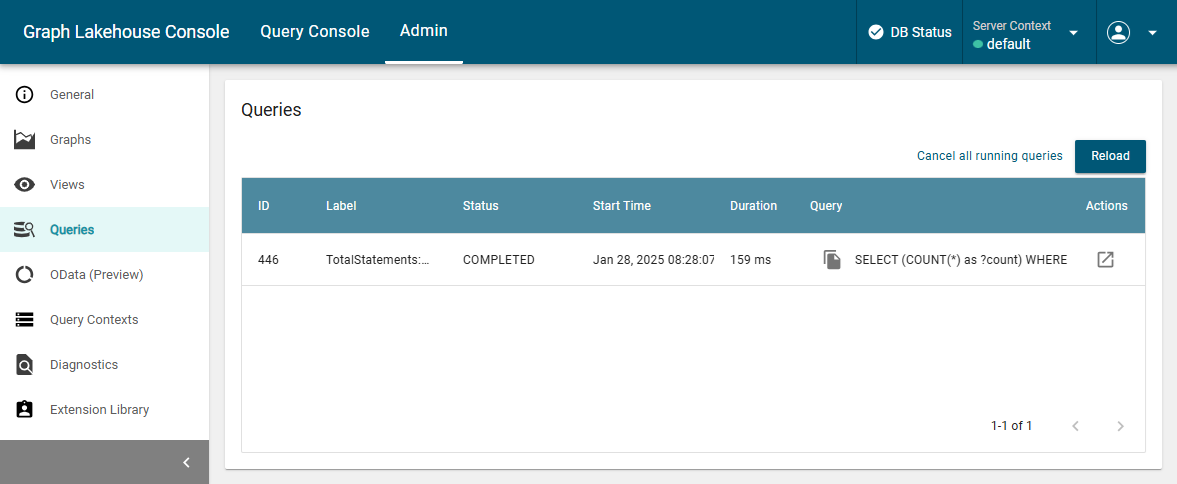
For each query, the screen shows the query ID, label, and status, as well as the start time and duration in milliseconds. The last column shows the query text. You can click the new window icon ( ) next to a query to copy that query into the Query editing window where you can edit and/or re-run the query.
OData (Preview)
Graph Lakehouse provides a "Data on Demand" service that allows users to define RESTful API endpoints using Open Data Protocol (OData)-based data feeds, which allow web-based access to Graph Lakehouse graph data. The RESTful API endpoints allow web clients to use simple HTTP messages to publish and edit resources that are identified using URLs and are defined in a data model.
The OData (Preview) menu option lets you view existing Data on Demand endpoints as well as create new endpoints. The following screen shows an example of a Data on Demand endpoint that provides access to a Tickit graph.
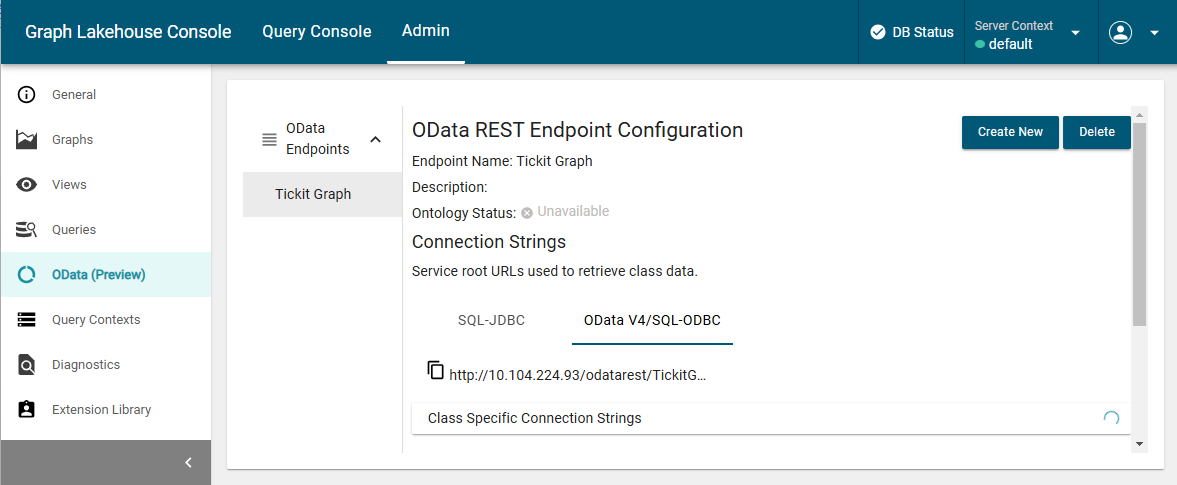
For more information and instructions on creating Data on Demand endpoints, see Access Data with OData Protocol.
Query Contexts
The Admin Query Contexts menu option lets you manage query contexts, which define sensitive data source connection details like keys, tokens, and user credentials. Queries that are run against a source can simply reference the keys in a context to avoid including sensitive information in the request. The following screen shows the display of currently defined query contexts and the options to add new context configurations as well as edit or delete contexts.

For more information and instructions on creating Query Contexts, see Use a Query Context.
Diagnostics
The Admin Diagnostics menu option displays and lets you download any existing Xray snapshot diagnostic files that Graph Lakehouse has generated in response to an error or database crash. When Altair Support requests Graph Lakehouse diagnostic files for troubleshooting an issue, you can quickly retrieve the files here.
There are two types of Graph Lakehouse diagnostic files:
- Xray: Xrays are generated on-demand. If you encounter an error and the database remains running, you generate an Xray to produce the diagnostic files.
- Crash: If you encounter an error that crashes the database, Graph Lakehouse automatically generates a crash file that contains diagnostic information about the crash.
See Getting Support for more information about the files, troubleshooting issues, and obtaining Altair Engineering Inc. support.
To retrieve an Xray file:
- Select the Diagnostics menu option from the Admin sidebar panel. The console displays the available options. For example:
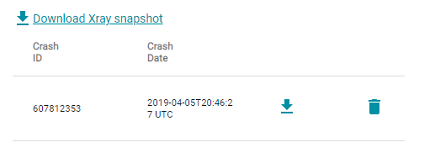
- If you want to retrieve an xray, click the Download Xray snapshot link. Graph Lakehouse creates the xray and produces a tarball with a .xray extension. The console downloads the .xray file to your computer.
- If you want to retrieve a crash dump, click the Refresh button to refresh the list of available crash dump .xray files. Click the file name that you want to download. The console downloads the .xray file to your computer.
Xray and crash dump files that you download are already compressed. Do not compress the files before sending them to Altair when they are requested for troubleshooting an issue.
Extension Library
The Admin Extensions menu option provides a display of extension libraries and extensions currently installed in Graph Lakehouse. From the list of libraries, you can expand or collapse library items to show all the extensions defined within those libraries. For example:

For the library and extension display, you can click the Info icon next to an item to obtain additional information about that library or extension.
User Role Management
This option only appears if you have enabled Graph Lakehouse access control. Selecting the User Role Management option lets you create roles and define permissions that control access to Graph Lakehouse data and determine the operations users can perform after they log in. For more information, see Create and Manage Roles from the Console.