Introduction to Hi-Res Analytics
Hi-Res Analytics dashboards enable you to create visual representations of your data using the latest in powerful web technologies. This introduction defines the fundamental concepts of working with dashboards and provides an overview of the Hi-Res Analytics user interface.
To fully leverage the advanced capabilities of Hi-Res Analytics, it helps to have skills working with Excel functions and formulas, SPARQL, and JavaScript and HTML. You can create dashboards without these skills but may not be able to take advantage of all functions.
Concepts and Vocabulary
| Term | Description |
|---|---|
| Dashboard | Dashboards enable you to view, analyze, and share your data. Data is viewed through lenses, such as tables and charts, that format the data for display. You can also apply filters to dashboards to refine the results. |
| Data Layer | Since Graphmarts can include multiple Data Layers, users can include or exclude the data from certain layers when creating or viewing dashboards. |
| Lens | Lenses are the structures that display your data. You must have at least one lens in a dashboard. You can reuse existing lenses or create new ones. For more information, see Creating a Lens. |
| Filter | Filters narrow and further define the data to display. Dashboard-level filters apply globally to all lenses in a dashboard. Lens-level filters apply only to a specific lens. For more information, see Creating Dashboard Filters. |
| Property | A property is a predicate that contains the instance data to display. The data type of a property determines the functional aspects within a dashboard. For example, certain filters act only on dates or numbers. |
| Path | Paths are relationships. They are transitional elements that allow you to traverse to another class. |
| Functions and formulas | Functions and formulas can be applied to properties to modify the data that is presented. Available functions depend on the property’s data type. For more information, see Calculating Values in Lenses and Filters. |
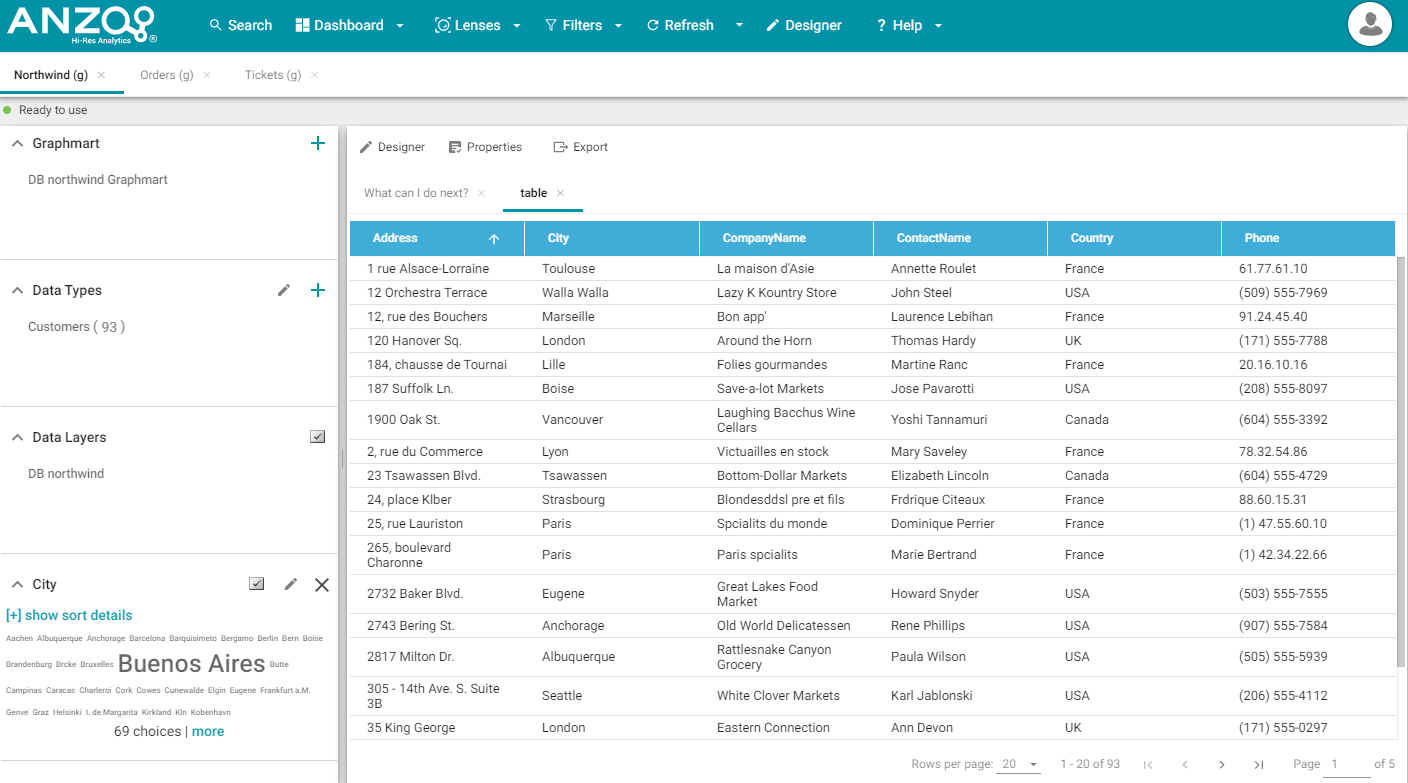
User Interface Overview
This section gives an overview of the user interface. The images below show an administrator view. Some options are not available to users with lower permission levels.
Main Toolbar
The toolbar at the top of the screen provides the following options:

- Dashboard: Accesses dashboard functions, including Save.
- Lenses: Creates or opens lenses.
- Filters: Creates or manages selected filters.
- Refresh: Accesses the automatic refresh check box. Select this box to refresh data automatically. New data will appear and change according to changes elsewhere.
- Designer: Controls dashboard layout and design.
- Help: Opens help options.
- User: Click to access the Logout button.
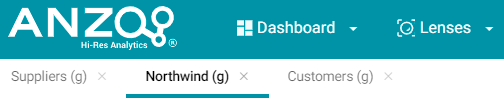
Dashboard Tabs
The dashboard tabs under the main toolbar display the open dashboards and enable you to navigate between dashboards. When you change a dashboard, an asterisk appears on the dashboard tab. Save the dashboard to preserve the changes.
Graphmart
The Graphmart panel displays the selected Graphmart for the dashboard:
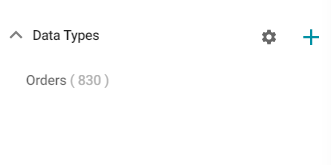
Data Types
The Data Types panel displays the selected data type from the Graphmart.
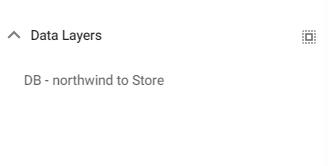
Data Layers
The Data Layers panel displays the Data Layers in the Graphmart.
Filters
By default, filters that you create appear in the left column of the dashboard.
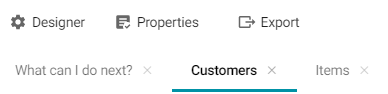
Object Toolbar and Tabs
The object toolbar and tabs enable you to manage the lenses and filters in the selected dashboard. The tabs display the open objects, and the toolbar enables you work with the object properties.