Introduction to Hi-Res Analytics
Anzo Hi-Res Analytics dashboards enable you to define and create visual data representations using the latest in powerful web technologies. This introduction defines the fundamental concepts of working with dashboards.
To fully leverage the advanced capabilities of Hi-Res Analytics, it helps to have skills working with Excel functions and formulas, SPARQL, and JavaScript and HTML. You can create dashboards without these skills but may not be able to take advantage of all functions.
Concepts and Vocabulary
| Term | Description |
|---|---|
| Dashboard | Dashboards enable you to view, edit, and share your data. You view data through lenses, such as tables, charts, or web pages, which format the data for display. You can apply filters to dashboards to refine the results. There are two types of dashboards: Dashboard and Graphmart dashboard. The type that you choose depends on whether you want to display data that is stored in a local Anzo volume, like system data, or AnzoGraph. Select the Dashboard type when working with data in a local Anzo volume, or select Graphmart dashboard when working with graphmarts stored in AnzoGraph. For more information, see Creating a Dashboard. |
| Data Layer | A graphmart can have any number of data layers that load additional data sets, mask certain data, infer new data, or create, clean, conform, or transform data. Users can choose to include or exclude the data from certain layers when creating or viewing Hi-Res Analytics. For more information, see Introduction to Data Layers. |
| Lens | Lenses are the structures that display your data. You must have at least one lens to view any of your data. You can reuse existing lenses or create new ones. For more information, see Creating a Lens. |
| Filter | Filters narrow and further define the data to display. Dashboard-level filters apply globally to all lenses in a dashboard. Lens-level filters apply only to a specific lens. You can also create subfilters to refine data based on additional criteria. For more information, see Creating a Dashboard Filter. |
| Property | A data property contains instances that can consist of different data types. The data types determine functional aspects within Hi-Res Analytics. For example, certain filters act only on dates or numbers. Relative paths are transitional elements that point you to another class. |
| Path | Paths are sequences of properties in an ontology that lead to certain values. For example, in an invoice you can find a phone number for the invoiced customer by following the customer > contact > phone path. |
| Functions and formulas | Each lens can use functions and formulas to determine what data is presented. Available functions depend on the property’s data type. For more information, see Calculating Values in Lenses and Filters. |
General Interface Elements
This section provides an overview of the user interface elements in the Hi-Res Analytics application.
Tabs
In the Hi-Res Analytics application, there are dashboard-level and object-level tabs. You can open multiple dashboards or objects at once and the tabs allow for navigation.
Object-level tabs control navigation between open lenses and filters in the center pane. All open lenses and filters with orientation set to Center appear as tabs in the center pane, under the appropriate dashboard tab. By default, a new lens appears in the center pane. New filters appear in the left pane.
When you change a dashboard, an asterisk appears on the dashboard name tab. Save the dashboard to preserve the changes.
Designer
Designer windows allow initial and further configuration of dashboards, lenses, and filters. Click the cog icon ( ) in the main toolbar to open the Designer for a dashboard, or click the cog icon in an object window to open the Designer for that object. With some exceptions, all settings available during creation are available for reconfiguration.
Dashboard Interface
The images in this section show the administrator views. Some options are not available to users with lower permission levels.
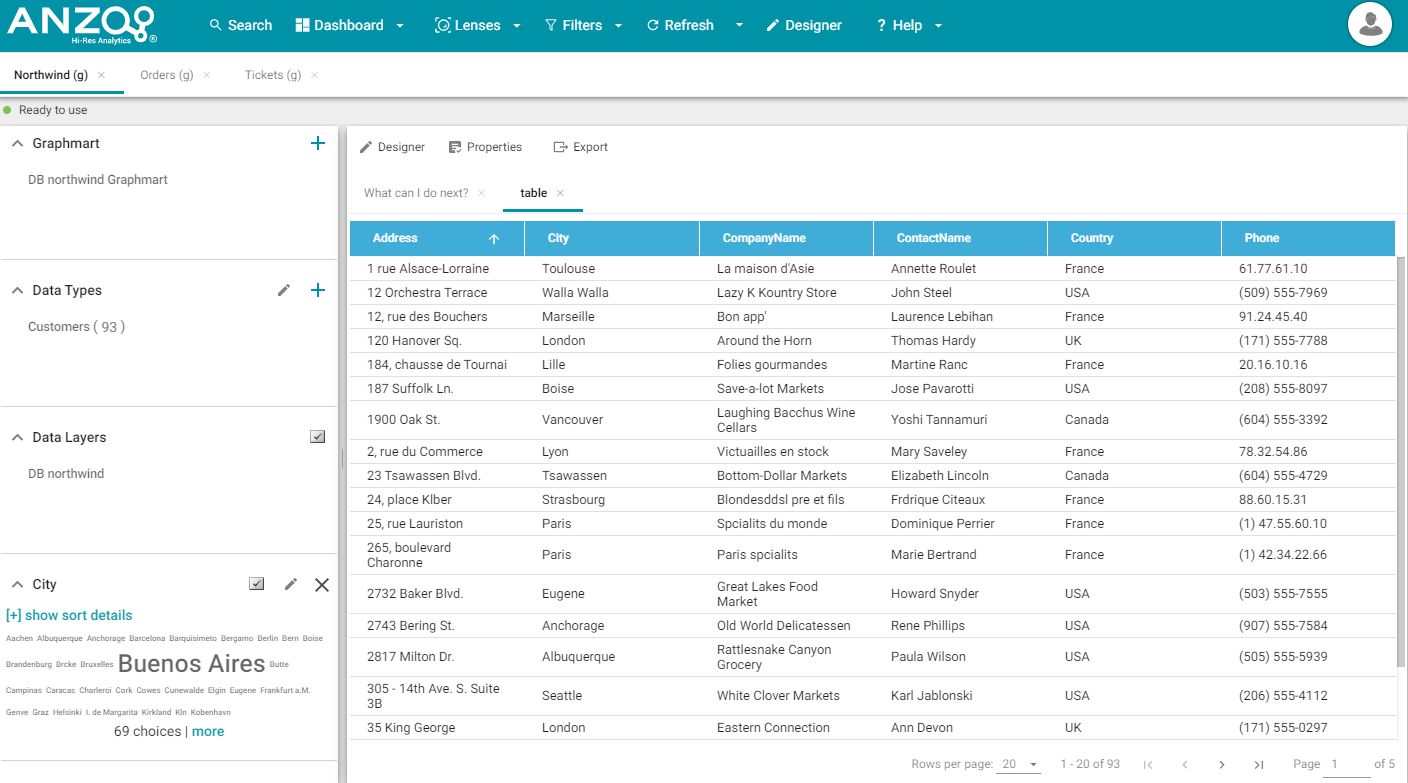
Main Toolbar
The toolbar at the top of the screen provides the following options:

- Search: Enables you to search for dashboard-level objects, such as linked data sets, dashboards, and system data sets.
- Dashboard: Accesses dashboard functions, including Save.
- Lenses: Creates or opens lenses.
- Filters: Creates or manages selected filters.
- Refresh: Accesses the automatic refresh check box. Select this box to refresh data automatically. New data will appear and change according to changes elsewhere.
- Designer: Controls dashboard layout and design.
- Help: Opens help options.
- User: Click to sign out as current user.
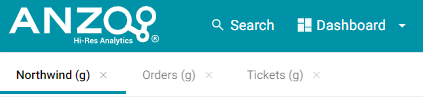
Dashboard Tabs
The dashboard tabs under the main toolbar display the open dashboards and enable you to click to view different dashboards.
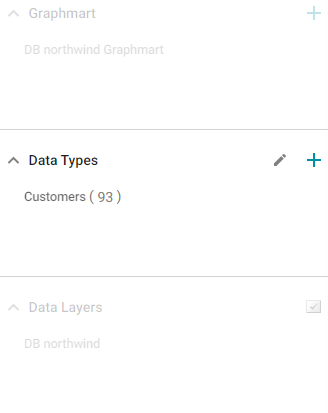
Graphmart
The Graphmart panel displays the selected graphmart for the dashboard.
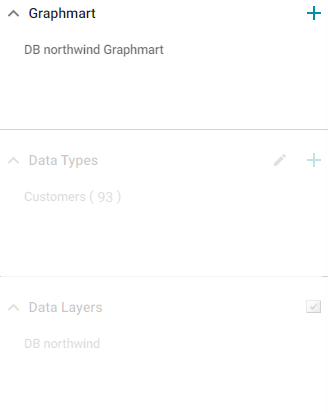
Data Types
The Data Types panel displays the selected data types for the dashboard's graphmart.
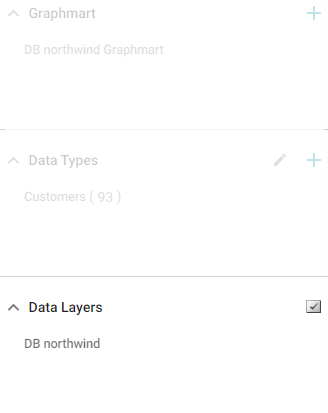
Data Layers
The Data Layers panel displays the data layers for the dashboard's graphmart.
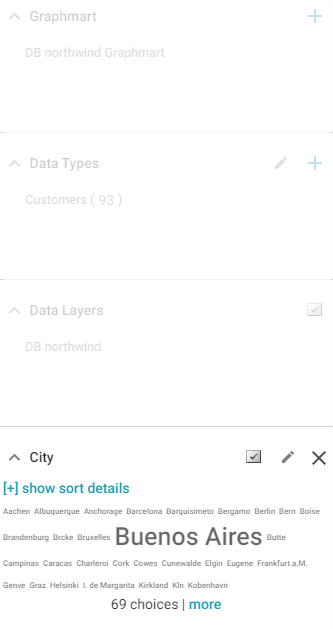
Filters
By default, filters that you create appear in the left column of the dashboard.
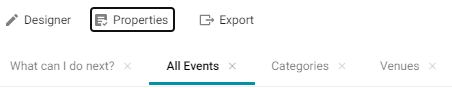
Object Toolbar and Tabs
The object toolbar and tabs enable you to manage the lenses and filters in the selected dashboard. The tabs display the open objects, and the toolbar enables you work with the object properties.